
Stock Market Commentary
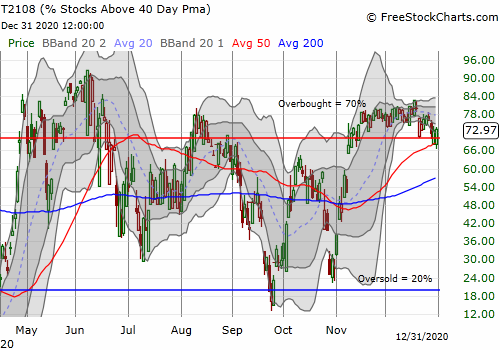
The extended overbought period still looks tenuous. For the second trading day in a row, AT40 (T2108), the percentage of stocks trading above their respective 40-day moving averages (DMAs), broke down below the overbought threshold of 70% before closing at 73.0%. The major indices do not reveal these weakening overbought conditions.
The Stock Market Indices
The S&P 500 (SPY) looked good with a 0.6% gain to an all-time high. Note that the close above the upper Bollinger Band (BB) makes the index a little extended.
The NASDAQ (COMPQX) ended the year with a flatline 0.1% gain. The tech-laden index has a little room to grow to hit the upper-BB.
Small caps still show the clearest sign of trouble. However, the iShares Trust Russell 2000 Index ETF (IWM) ended the year with the slightest rebound. IWM jumped away from uptrending 20DMA support to close with a 0.2% loss. If the overbought period does not end in the next few trading days, I will look to buy IWM calls.
Stock Market Volatility
The volatility index (VIX) jumped off its intraday low for another stubborn display of trading. The stage remains set for a fresh surge in volatility. Support at 20 seems more and more solid.
The Short-Term Trading Call: Weakening Overbought Conditions

- AT40 = 73.0% of stocks are trading above their respective 40-day moving averages (Day #33 overbought)
- AT200 = 86.0% of stocks are trading above their respective 200-day moving averages (TradingView’s calculation).
- Short-term Trading Call: neutral
AT40 (T2108), the percentage of stocks trading above their respective 40DMAs, closed at 73.0%. My favorite technical indicator struggled for the second day in a row to hold on to overbought conditions. An end to the weakening overbought conditions appears imminent.
A mild pullback in the coming days (weeks?) would be consistent with what I called a bullish kind of bearish call from Tony Dwyer in early December. I now have double hedges going. A pundit on CNBC’s Fast Money gave me the idea to buy March $5 UVXY calls. An options trader on the same program (different episode) gave me the idea to buy a February $370/$320 SPY put spread. Both positions pay off big in the case of a particularly bad (and sharp) sell-off. Otherwise, I consider these positions to be confidence boosters if I am still trading long in weakening overbought conditions.
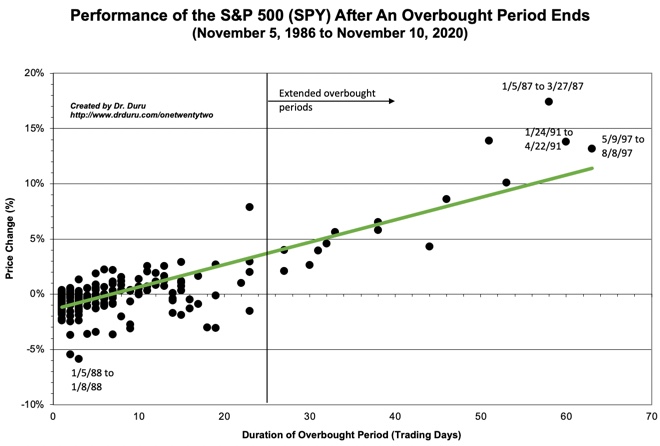
The stock market is on day #33 of overbought conditions. The S&P 500 has 4.8% in gains since overbought trading resumed on November 13th. The slight underperformance in the index per the chart below still surprises me (compare to the green trendline). In other words, an imminent end to the overbought period would create a notable adjustment in the historical trendline.
Stock Chart Reviews – Below the 50DMA
Splunk (SPLK)
The 200DMA breakout failed to hold for Splunk (SPLK). This rejection ends my interest in a new post-earnings trade on SPLK. Buyers now must prove themselves with a 50DMA breakout.
Lululemon Athletica Inc (LULU)
Lululemon Athletica Inc (LULU) lost 6.7% post-earnings but rebounded immediately off 50DMA support. Despite a subsequent 6.3% surge that took LULU close to its all-time high, the stock could not sustain momentum. LULU ended the year drifting right back to 50DMA support. The stock is a buy here with a stop below the post-earnings low.
Stock Chart Reviews – Above the 50DMA
Teucrium Corn Fund Shares (CORN)
After I flagged the bullish breakout in Teucrium Corn Fund (CORN) in October, I never imagined this sleepy ETN could start acting like a speculative technology stock. CORN now sits at a 16-month high as the fundamentals behind rising food prices remain solidly in place.
Caterpillar Inc (CAT)
Caterpillar (CAT) cooled off after hitting an all-time high December 4th. As a result, my industrial trades on CAT did not work for 2 weeks. Still, I used the dip earlier in the week to trigger the trade yet one more time.
Intel (INTC)
Hedge fund meddling arrived just in time for my latest between earnings call options in Intel (INTC). Third Point wants INTC to explore strategic alternatives, and that news was worth a 4.9% pop in the stock. I did not take profits on my call options that day. However, on Friday’s 2.2% gain I rushed to take profits. I am not likely to pull the trigger on this trade again until after January earnings.
Here is Intel’s boilerplate, 2 sentence response to Third Point:
“Intel Corporation welcomes input from all investors regarding enhanced shareholder value. In that spirit, we look forward to engaging with Third Point LLC on their ideas towards that goal.”
Nike (NKE)
Nike (NKE) popped 4.9% post-earnings a day after dropping 2.3%. The post-earnings momentum quickly dissipated as the stock drifted toward 20DMA support. If the overbought period persists, NKE is a buy here with a stop below support.
PayPal Holdings Inc (PYPL)
With Bitcoin (BTC/USD) soaring, I wrote about the attractiveness of PayPal Holdings (PYPL) as a crypto trading platform. The stock drifted lower from there. As a result, the stock looks set up for a buy as it levitates above 20DMA support. I like PYPL regardless of the durability of the current overbought period. I might start with a call spread before taking a stand with shares.
Shopify (SHOP)
The last breakout to an all-time high quickly faded for Shopify (SHOP). A 2.7% loss planted SHOP right on top of the 20DMA and the breakout point. SHOP is a buy on a bounce off this support.
Tesla (TSLA)
A year-end post is incomplete without Tesla (TSLA)! TSLA gained 743% for the year 2020. The stock is the poster child for how aggressive bullishness paid off in 2020. Under more “normal” circumstances, I would have called the buying in stocks like TSLA “reckless.” In 2020, this kind of trading and investing looked smart. TSLA is now worth a mind-boggling $669B in market cap. TSLA earned $28.2B in revenues in the trailing 12 months.
My trading in TSLA was quite sub-optimal. Only in the last 3-4 months did I focus strictly on bullish trades on TSLA. TSLA ended the year with an all-time high, and I plowed right into a weekly calendar call spread.
Workday (WDAY)
Out of nowhere, Workday (WDAY) popped 6.4% to an all-time high. Buyers lost all enthusiasm after that surge. WDAY reversed those gains and then some going into the end of the year. I used the reversal to buy a call spread. I am assuming that sudden surge was not just a blow-off top.
Be careful out there!
Footnotes
“Above the 40” (AT40) uses the percentage of stocks trading above their respective 40-day moving averages (DMAs) to measure breadth in he stock market. Breadth indicates the distribution of participation in a rally or sell-off. As a result, AT40 can identify extremes in market sentiment that are likely to reverse. Above the 40 is my alternative name for “T2108” which was created by Worden. Learn more about T2108 on my T2108 Resource Page. AT200, or T2107, measures the percentage of stocks trading above their respective 200DMAs.
Active AT40 (T2108) periods: Day #56 over 20%, Day #40 above 30%, Day #39 over 40%, Day #38 over 50%, Day #37 over 60%, Day #33 over 70%


Red line: Overbought threshold (70%); Blue line: Oversold threshold (20%). Source: FreestockCharts
Source for charts unless otherwise noted: TradingView.com
Full disclosure: long UVXY shares and calls, long SPY put spread, long WDAY call spread, long CAT calls, long CORN, long TSLA calendar call spread
FOLLOW Dr. Duru’s commentary on financial markets via StockTwits, Twitter, and even Instagram!
*Charting notes: FreeStockCharts stock prices are not adjusted for dividends. TradingView.com charts for currencies use Tokyo time as the start of the forex trading day.