
A Triumph of Liquidity: New Overbought Period for Stocks Despite Political Chaos

Stock Market Commentary One hundred and fifty minutes. The bearish signal that hit the stock market after the last overbought period ended essentially lasted just 150 minutes. Buyers stepped into the market on Monday after lunchtime on the East Coast and essentially barely took a pause until the last 2 hours of trading today (Wednesday, … Read more
Housing Stocks In Limbo Amid New Signs of Market Normalization – Housing Market Review (December, 2020)

Housing Market Intro and Summary In recent months a divergence in the housing market emerged between rangebound home builder stocks and strong housing data. In October, new home sales recorded a third straight month at the 1 million mark. Since new home sales hit an August peak, the stocks of home builders have also largely … Read more

An Extended Overbought Rally Moves Into Historic Territory (Above the 40) – December 18, 2020

Stock Market Commentary The Federal Reserve signaled an incremental improvement in its economic outlook by making an allowance for limited stock repurchases and dividends by the country’s top financial institutions. As a result, bank stocks apparently soared in after hours trading. That fresh rally in financials should extend to a positive open on Monday and … Read more

Record Confidence, Rangebound Sales and Stocks – Housing Market Review (November, 2020)

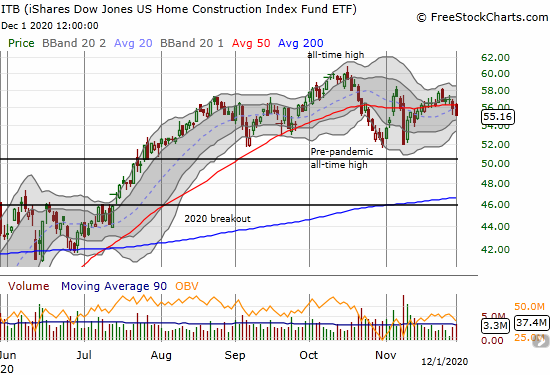
The iShares Dow Jones US Home Construction Index Fund (ITB) lost 1.4% as it continues to pivot around its 50-day moving average in an extended trading range.

Housing Market Intro and Summary A divergence in the housing market emerged between rangebound home builder stocks and strong housing data. In October, new home sales recorded a third straight month at the 1 million mark. Since new home sales hit the August peak, the stocks of home builders have also largely gone nowhere. A … Read more

Bearish Indices and Bullish Reopen Stocks Create Abrupt Rotation – Above the 40 (November 9, 2020)

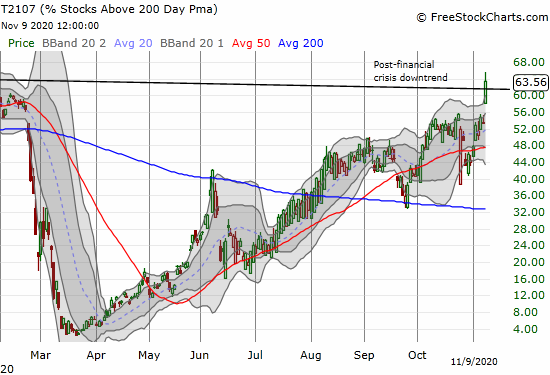
AT200 (T2107) surged 10 percentage points to close near a 3-year high and a breakout above the post financial crisis downtrend.

Stock Market Statistics AT40 = 67.8% of stocks are trading above their respective 40-day moving averages (DMAs) (high of 75.1%) AT200 = 63.6% of stocks are trading above their respective 200DMAs (near 3-year high and breakout above post financial crisis downtrend) VIX = 25.8 (as low as 22.4) Short-term Trading Call: neutral Stock Market Commentary … Read more