
Housing Market Intro and Summary
In recent months a divergence in the housing market emerged between rangebound home builder stocks and strong housing data. In October, new home sales recorded a third straight month at the 1 million mark. Since new home sales hit an August peak, the stocks of home builders have also largely gone nowhere. Now the housing data show additional signs of slowing and even plateauing more in line with seasonal expectations. As a result, these signs of market normalization are leaving housing stocks in a kind of limbo, albeit at elevated levels.
Housing Stocks
The iShares Dow Jones US Home Construction Index Fund (ITB) summarizes the condition of the majority of home builder stocks. The housing ETF has gone nowhere in about 5 months. ITB drifted listlessly into the end of 2020. A 1-day boost from a Lennar Corp (LEN) earnings report failed to generate follow-through momentum. Indeed, ITB closed within a hair of its 50-day moving average (DMA) as support and nearly finished reversing all its gains from the Lennar boost.
Without meaningful pullbacks in housing-related stocks, I only added one more housing play since the last Housing Market Review. I bought a calendar call spread in LEN ahead of the company’s earnings. I used the premium of the short side to help pay for the long side. However, LEN soared 7.6% post-earnings and blew right past my $75 strike. Since I did not want to lose the long side of the trade (a February expiration), I rolled the short side into a new short call with an $82 strike expiring on January 8th. I plan to roll short calls at least two more times before the long call expires.
With the housing market seemingly normalizing, the tremendous gains for Redfin (RDFN) really stand out in stark contrast with much of the housing sector. RDFN sold off after early November earnings. After four days of selling, RDFN turned on a dime and rallied 109% before peaking at its final all-time high on December 22nd. Given the stock’s current strength, I want to buy into the current dip. For example, if the uptrending 20DMA holds as support, RDFN becomes buyable for a fresh rally.
Housing Data
New Residential Construction (Single-Family Housing Starts) – November, 2020
November single-family home starts reached 1,186,000 which was 1.3% above October’s 1,181,000 starts (slightly revised upward) and was an impressive 22.2% above October, 2019. As a result, housing starts hit a marginal new 13+ year high. The rate of year-over-year change has been positive for five straight months. However, November’s monthly gain was the smallest since rebound from the April trough. A slowdown makes sense in the context of normalizing new home sales.
Source: US. Bureau of the Census, Privately Owned Housing Starts: 1-Unit Structures [HOUST1F], first retrieved from FRED, Federal Reserve Bank of St. Louis, December 28, 2020.
For August, the Northeast was the one region that somehow managed to print a year-over-year decline in starts. In October, the Northeast managed a large sequential decline of 17.9%. For November, the Northeast declined year-over-year again. Accordingly, the Northeast is a general laggard. While Northeast starts neared a (marginal) 13-year high in June, starts have already returned to levels normalized since the financial crisis.

Housing starts in the Northeast, Midwest, South, and West each changed -9.2%, +24.5%, +29.4%, +33.2% respectively year-over-year.
Existing Home Sales – November, 2020
Existing home sales slipped a little off 14-year highs in November. In the September report, the National Association of Realtors (NAR) marveled at the counter-seasonal strength for the housing market. In the October report, the NAR marveled at the counter-recessionary strength in the housing market. The surprise continued in the November report: “Given the COVID-19 pandemic, it’s amazing that the housing sector is outperforming expectations.” The NAR still expects robust growth in 2021.
The seasonally adjusted annualized sales in November of 6.69M decreased 2.5% month-over-month from the slightly upwardly revised 6.86M in existing sales for October. Year-over-year sales still jumped 25.8%, slightly below October’s year-over-year gain.
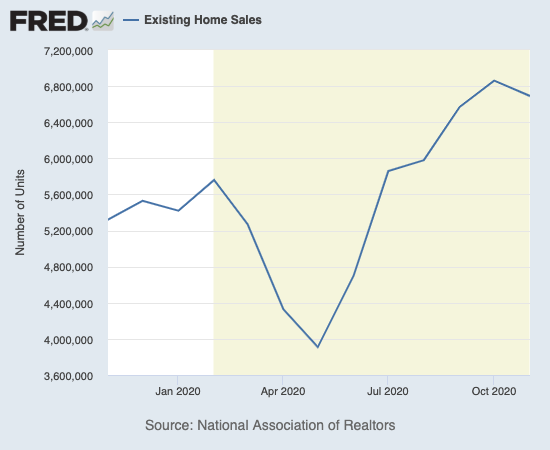
(As of the March, 2018 data, the NAR further reduced historical data to just 13 months. For historical data from 1999 to 2014, click here. For historical data from 2014 to 2018, click here) Source for chart: National Association of Realtors, Existing Home Sales© [EXHOSLUSM495S], retrieved from FRED, Federal Reserve Bank of St. Louis, December 28, 2020.

The absolute inventory level of 1.28M homes dropped significantly from October by 9.9%. Inventory plunged 22% from a year ago (compare to October’s 19.8%, September’s 19.2%, August’s 18.6%, July’s 21.1%, June’s 18.2%, May’s 18.8%, April’s 19.7%, March’s 10.2%, February’s 9.8%, January’s 10.7% and December, 2019’s 8.5% year-over-year declines, unrevised). Incredibly, the inventory situation for existing homes continues to worsen. “Unsold inventory sits at an all-time low 2.3-month supply at the current sales pace, down from 2.5 months in October and down from the 3.7-month figure recorded in November 2019.”
The record low 2.3 months of supply for existing homes broke the previous month’s record low. The average 21 days it took to sell a home matched the record lows set in September and October. The on-going year-over-year decline in inventory is now on a 18-month streak. The tightening constraint shoves prices ever higher and exacerbates affordability issues. The NAR returned to worrying about affordability: “Housing affordability, which had greatly benefitted from falling mortgage rates, are now being challenged due to record-high home prices…That could place strain on some potential consumers, particularly first-time buyers.”.
The median price of an existing home hit $310,800 and represents a sizable year-over-year jump of 14.6%. Prices have now increased year-over-year for 105 straight months. The median price was 0.7% lower than October’s price, the first month-over-month decline since May.
First-time home buyers took a 32% share of sales in November. This share equals the 32% in September and October and the 32% a year ago. The share of first-time home buyers for existing homes never followed the narrative this year of first-time millennials rushing into the housing market. The NAR’s 2017 Profile of Home Buyers and Sellers reported an average of 34% for 2017, 33% for 2018, 33% for 2019, and 31% for 2020.
Investors stepped into the breach in May by increasing from April’s 10% share of sales to 14%. Except for a (seasonal?) drop to 9% in June and a 12% share in August, investors have maintained a 14-15% share. Investors held a 14% share in October and November. This is a notable decline from the 16% share a year ago.
For the third month in a row, existing home sales surged across all regions on a year-over-year basis. The regional year-over-year changes were: Northeast +25.7%, Midwest +24.2%, South +25.9%, West +27.3%.
From September, 2019 through April, 2020, all regions experienced notable and robust price jumps. In May, the West finally broke that streak with a rare price pullback. All regions have recorded strong price gains since May. The regional October price gains were on balance even more breathtaking than September’s. The November price gains “cooled” back down a bit: Northeast +17.4%, Midwest +14.6%, South +15.0%, West +13.8%.
Single-family home sales declined 2.4% from October and increased on a yearly basis by 25.6%. The median price of $315,500 was up 15.1% year-over-year.
{video will be posted once available from the NAR}
California Existing Home Sales – November, 2020
The report from the California Association of Realtors (C.AR.) delivered a familiar message: buyers are snapping up a limited supply of homes and setting records or hitting decade-plus highs in the process. Here are some highlights of the extremes in the California market for existing single-family homes:
- The 26.3% year-over-year jump in sales was the highest percentage gain since May, 2009.
- The 508,820 single-family existing homes sold was the highest level in 15 years.
- The median number of days to sell a home set a record low at 9 days – compare to 25 days a year ago and the 21 days for country overall.
- The sales-price-to-list-price ratio of 100.5% is a 30-year high – compare to 98.4% a year ago.
- The average price per square foot of $332 was last seen in August, 2007 – compare to $288 a year ago (a 15.3% increase)
Californian existing home sales bucked the month-over-month trend for the country as a whole. Existing single-family home sales increased 5.0% from October and 26.3% year-over-year. The median home price of $699,000 was a second monthly decline (down 1.7%) but still up 18.5% year-over-year. Sales in resort areas picked up the pace again and achieved astounding gains.
“Mammoth Lakes had the biggest increase in November, with sales surging 400 percent from November 2019, followed by South Lake Tahoe (81.4 percent), Big Bear (73.9 percent), and Lake Arrowhead (58.1 percent)…On a year-to-date basis, sales increased 97 percent in Big Bear, 51.5 percent in South Lake Tahoe, 48.4 percent in Lake Arrowhead, and 31.7 percent in Mammoth Lakes…
…Big Bear’s median price jumped from last year by 40.8 percent, followed by South Lake Tahoe (39.6 percent), and Lake Arrowhead (32.0 percent). Mammoth Lakes had a slight price decline of 2.5 percent in November from last year.”
Across California, listings continued to disappear with all but one region losing listings at more than a 40% year-over-year pace. Inventory stayed flat at 16-year lows. The Unsold Inventory Index (UII) plunged again year-over-year from 3.1 to 1.9 months of supply.
Existing home sales in California are on a collision course between affordability and robust demand.
New Residential Sales (Single-Family) – November, 2020
New home single-family sales leaned on the pause button and declined on a monthly basis for the second month in a row. This behavior is of course expected on a seasonal basis, but it stands out in stark relief to the strong recessionary run-up. Last year, November new home sales declined just 1.4% from October. This year, November sales of 841,000 declined 11.0% from the downwardly revised sales in October of 945,000. These sales were up 20.8% year-over-year. These sales numbers start to make me wonder whether the summer surge included a lot of pull forward of demand as well as make-up for the initial pandemic plunge.
Source: US. Bureau of the Census, New One Family Houses Sold: United States [HSN1F], first retrieved from FRED, Federal Reserve Bank of St. Louis, December 31, 2020.
Median home prices for new home sales continue an extended period of stabilization. The median price hit a peak in November, 2017 at $343,400. Since then, it hit a low of $305,400 in January, 2019. In November, the median price dropped ever so slightly again this time by 0.7% from October. The median price is up 2.2% year-over-year. As I have noted in previous posts, this price range is a distinct contrast to the relentless ascent in price for existing homes. The shrinking footprint of new homes has likely kept in check the median price. Of course for existing homes, square footage is slower to change as it requires large-scale turnover in the housing stock.
Source for chart: U.S. Census Bureau and U.S. Department of Housing and Urban Development, New Privately Owned Housing Starts in the United States, Average Square Feet of Floor Area for One-Family Units [HOUSTSFLAA1FQ], retrieved from FRED, Federal Reserve Bank of St. Louis; December 31, 2020.
The monthly inventory of new homes for sale declined from 4.8 in May to 3.4 in August. Inventory declined again in October to 3.3 from 3.6 months of sales in September. Inventory jumped back up to 4.1 months of sales in November.
The Northeast was a drag on the sale of new homes in September but led the way in October. The Midwest was the big drag in November despite the strong gains in the region for existing home sales. The Northeast increased year-over-year by 18.2%. The Midwest plunged 24.4%. The South soared 30.5% year-over-year. The West increased 18.9%.
Home Builder Confidence: The Housing Market Index – December, 2020
The National Association of Home Builders (NAHB) reported a small monthly decline in the NAHB/Wells Fargo Housing Market Index (HMI). The HMI of 86 is the first drop since the April trough and follows four straight all-time highs for builder sentiment.
All three components of the HMI pulled back by equal point amounts. These small declines do not change the contours of the bullishness of U.S. builders. Yet, the NAHB focused on the dour parts of the housing outlook:
“Builder confidence fell back from historic levels in December, as housing remains a bright spot for a recovering economy…The issues that have limited housing supply in recent years, including land and material availability and a persistent skilled labor shortage, will continue to place upward pressure on construction costs. As the economy improves with the deployment of a COVID-19 vaccine, interest rates will increase in 2021, further challenging housing affordability in the face of strong demand for single-family homes.”
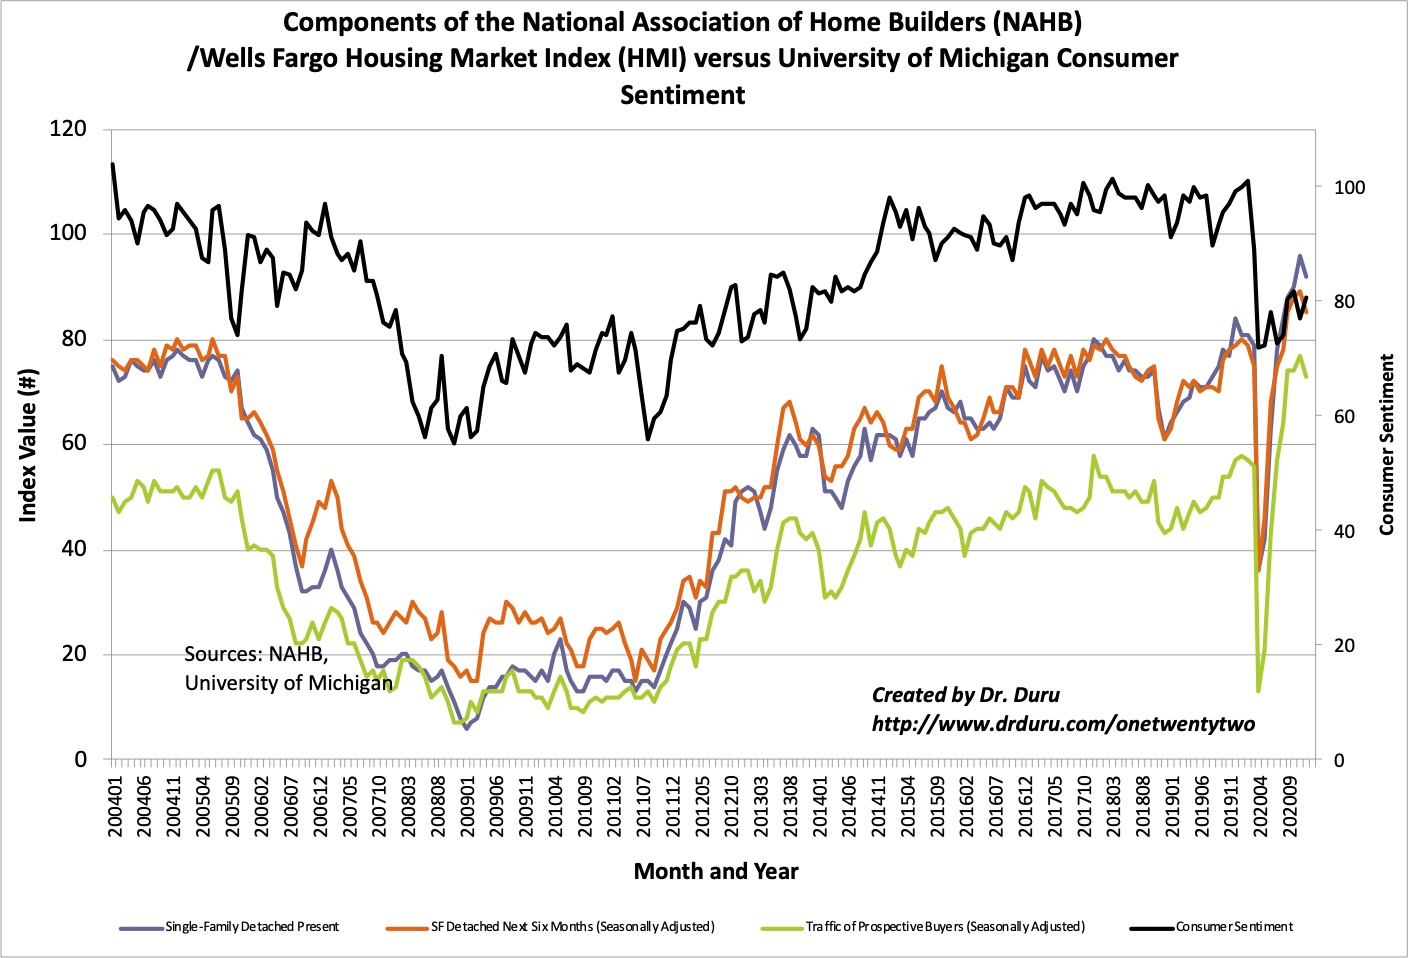
Source for data: NAHB
I have warily eyed the divergence between builder and consumer sentiment. Consumer sentiment mostly recovered from November’s dip, but hopes and anticipation for the Christmas season likely drove that. Overall, builder sentiment continues to far outstrip the general sentiment of the average American consumer.
All four regional HMIs followed the overall HMI lower. The Northeast continued its drop from October’s all-time high and hit 78 for December. The Midwest dropped from its all-time high of 85 to 82. The South fell from its all-time high of 90 to 87. The West fell the least going from its all-time high of 98 to 96. (Note I confirmed with the NAHB that 100 is the maximum level for HMI).
Home closing thoughts
Neighborhood Defenders
Katherine Levine Einstein, an author political scientist from Boston University, spoke with EconTalk’s Russ Roberts about her book “Neighborhood Defenders.” Einstein discussed how a select few local residents can exert an out-sized influence on the availability of local housing. These activated people apply pressure through public hearings that review development projects. Zoning and permit laws enable an assortment of pressure tactics including delay, project reduction, and outright rejection. As a result, neighborhoods incur higher housing costs while implementing exclusionary housing policies. The podcast/highlights are a must for anyone interested in issues of housing availability and access.
Housing Affordability
In a previous Housing Market Review, I recommended listening to KQED’s podcast “Sold Out: Rethinking Housing in America.” The 7-part series, with a primary focus on the San Francisco Bay Area, takes a hard look at history and current economics and policies that have negatively impact housing availability and affordability. The series also points to policies and efforts that are working to help extend housing to more people.
Last month, KQED broadcast on Facebook an assembly of Sold Out journalists along with housing activists to discuss housing affordability in the Bay Area. The panel was like a specific example and demonstration of the points from “Neighborhood Defenders.” The panel also discussed how public/private partnerships are making a positive difference in the housing market. Alphabet (GOOG), Apple (AAPL), Facebook (FB), and Cisco (CSCO) have all funded various initiatives. A pastor described how East Palo Alto moved fast to create modular, affordable homes. This panel also introduced me to an important audit of California’s housing shortcomings.
California’s Auditor Slams State’s Efforts to Address Housing Affordability
California’s Auditor released a damning report on November 17, 2020 that exposed serious deficiencies in California’s ability to address housing affordability in the state. The report, titled “California’s Housing Agencies: The State Must Overhaul Its Approach to Affordable Housing Development to Help Relieve Millions of Californians’ Burdensome Housing Costs“, included a summary that speaks to incompetency, financial waste, and misallocated authority:
- The State’s approach to planning and financing the development of affordable housing at both the state and local levels is ineffective.
- Four key state agencies contribute to the State’s basic housing efforts, but there is no sound, well-coordinated strategy or plan to most effectively use their financial resources to support affordable housing.
- The lack of a comprehensive plan allowed one agency to mismanage and ultimately lose $2.7 billion in bond resources.
- The four agencies’ requirements are misaligned and inconsistent, which results in an unnecessarily cumbersome process for awarding their financial resources.
- Local jurisdictions have created local barriers such as restrictions on the number of units developers can build and lengthy project approval processes.
- State law and oversight are not strong enough to ensure that cities and counties are doing their part to facilitate the construction of affordable housing.
- We reviewed cases in which local jurisdictions acted inconsistently with state law and/or delayed projects, yet the State lacks authority to ensure affordable housing is built in a timely manner.
Hopefully this scathing report triggers real action in the coming months and years. I find it particularly infuriating that government officials wasted billions in a time when resources are tighter than ever.
Mean Reversion for the Hot Housing Trends
Matthew Pointon of Capital Economics talked with the CNBC Fast Money crew on December 28th about the potential for “mean reversion” in the housing market. The starts, sentiment, and new home sales data as shown above are already showing signs of some normalization in the market. Pointon flags a bottom in mortgage rates, exhaustion of pent-up demand, limited supplies, a drop in rents in cities, and a normalization to life with the availability of coronavirus vaccines as dynamics converging to cool housing markets back down to a more normal pace….or at least what counts as normal after the financial crisis.
Be careful out there!
Full disclosure: long LEN calendar call spread