
Housing Market Intro and Summary
A divergence in the housing market emerged between rangebound home builder stocks and strong housing data. In October, new home sales recorded a third straight month at the 1 million mark. Since new home sales hit the August peak, the stocks of home builders have also largely gone nowhere. A little more than a month ahead of the peak, I wrote a piece touting the attraction of investing in home builders as a way to invest in soaring homeownership rates.
The sentiment of home builders is undeterred by the rangebound sales and stocks. The readings on home builder confidence shattered records again in the latest report. In turn, this confidence helps to drive soaring growth in housing starts. Languishing consumer sentiment further highlights the contrasting directions. At some point soon, these housing forces should realign.
In the meantime, the trading action yields few opportunities for implementing the seasonal trade in home builders. October’s pullback provided good entries which turned profitable in November’s rebound. A large pullback in November provided one more opportunity. The current stall in new home sales may generate the next seasonal buying opportunity.
Housing Stocks
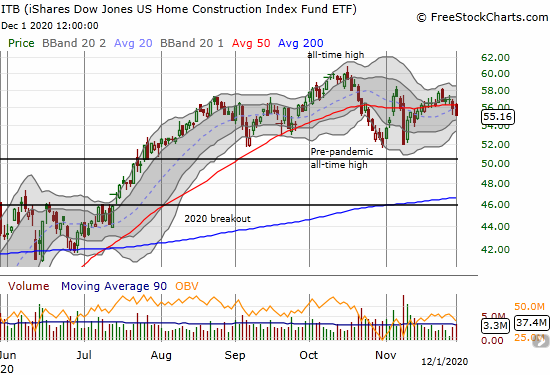
Stock charts for October showed divergences in the housing market. In November, these divergences became more muted. Overall, housing-related stocks are stuck in a 4 month and growing trading range.
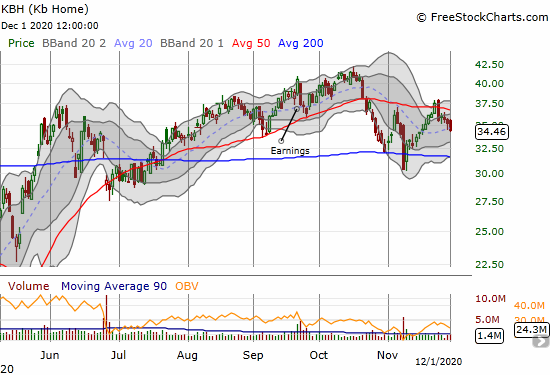
I have one standing seasonal trade in KB Home (KBH) still left from the latest round of trades. As a reminder, I am selling call options against KBH for as long as the market leaves me with the position for the duration of the seasonal trade.
Lennar (LEN) suddenly dropped 3.5% as a leading laggard among the stocks of home builders. This pullback may provide my next seasonal trade with a buy at or above the lows that held in October.

Housing market services company Redfin (RDFN) is one of the few housing-related stocks coming into December with a positive polish. With a bullish breakout above 50DMA resistance, RDFN completed an impressive recovery from post-earnings weakness.
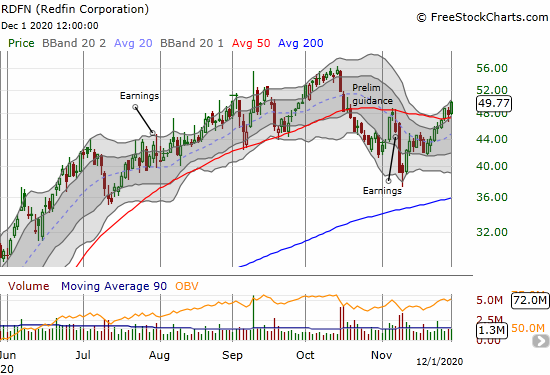
Given the confirmed 50DMA breakout, I need to consider ending a pairs trade with RDFN put options and Zillow Group (ZG) call options – time to go long both.
Housing Data
New Residential Construction (Single-Family Housing Starts) – October, 2020
The relative building frenzy continues. As a result, housing starts hit another 13+ year high. October single-family home starts reached 1,179,000 which was 6.4% above September’s 1,108,000 starts (unrevised) and was an impressive 29.4% above September, 2019. After two straight months of significant upward revisions, September and October surprised with no revision of the prior month data on housing starts. The rate of year-over-year change has been positive for four straight months.
Source: US. Bureau of the Census, Privately Owned Housing Starts: 1-Unit Structures [HOUST1F], first retrieved from FRED, Federal Reserve Bank of St. Louis, November 27, 2020.
For August, the Northeast was the one region that somehow managed to print a year-over-year decline in starts. This time, for October, the Northeast managed a large sequential decline of 17.9%. In September and now October, three of four regions ripped higher year-over-year. The Northeast, Midwest, South, and West each changed +41.0%, +33.6%, +28.2%, +28.1% respectively. Starts in the West finally hurdled over the post financial crisis high set in January, 2020.
Existing Home Sales – October, 2020
Existing home sales reached another 14-year high in October despite more declines in inventory and further increases in prices.
In the September report, the National Association of Realtors (NAR) marveled at the counter-seasonal strength for the housing market. In the October report, the NAR marveled at the counter-recessionary strength in the housing market: “Considering that we remain in a period of stubbornly high unemployment relative to pre-pandemic levels, the housing sector has performed remarkably well this year.” Existing home sales have now managed to reverse the losses initially suffered at the beginning of the coronavirus pandemic.
The seasonally adjusted annualized sales in October of 6.85M increased 4.3% month-over-month from the slightly upwardly revised 6.57M in existing sales for September. Year-over-year sales soared 26.6%, easily surpassing September’s 20.9% year-over-year gain.

(As of the March, 2018 data, the NAR further reduced historical data to just 13 months. For historical data from 1999 to 2014, click here. For historical data from 2014 to 2018, click here) Source for chart: National Association of Realtors, Existing Home Sales© [EXHOSLUSM495S], retrieved from FRED, Federal Reserve Bank of St. Louis, November 27, 2020.

The absolute inventory levels of 1.42M homes dropped a bit from September by 2.7%. Inventory plunged 19.8% from a year ago (compare to September’s 19.2%, August’s 18.6%, July’s 21.1%, June’s 18.2%, May’s 18.8%, April’s 19.7%, March’s 10.2%, February’s 9.8%, January’s 10.7% and December’s 8.5% year-over-year declines, unrevised). “Unsold inventory sits at an all-time low 2.5-month supply at the current sales pace, down from 2.7 months in September and down from the 3.9-month figure recorded in October 2019.”
The 2.5 months of supply is a new record low for existing homes; September held the previous record of 2.7. The average 21 days it took to sell a home matched the record low set in September. The on-going year-over-year decline in inventory is now on a 17-month streak. The tightening constraint on supply continues to shove prices ever higher and exacerbate affordability issues. Moreover, the extremes of supply scarcity threaten to limit sales growth.
The median price of an existing home set a fresh record. The $313,000 price tag represents a large year-over-year jump of 16% and the 104th straight month of a year-over-year gain. This surge was greater than September’s 14.8% year-over-year gain. The median price was only 0.5% higher than September’s price which was revised slightly lower.
First-time home buyers took a 32% share of sales in October, up from 32% in September and the 32% a year ago. Despite the on-going narrative of first-timer millennials rushing into the market, the share of first-time home buyers still does not demonstrate an up-trend. As I noted in the previous Housing Market Review, it is very possible they prefer new over existing homes. The NAR’s 2017 Profile of Home Buyers and Sellers reported an average of 34% for 2017, 33% for 2018, 33% for 2019, and 31% for 2020.
Investors stepped into the breach in May by increasing from April’s 10% share of sales to 14%. Except for a (seasonal?) drop to 9% in June and a 12% share in August, investors have maintained a 14-15% share. Investors held a 14% share in October.
For the second month in a row, existing home sales surged across all regions. The regional year-over-year changes were: Northeast +30.4%, Midwest +28.1%, South +26.5%, West +22.8%.
From September, 2019 through April, 2020, all regions experienced notable and robust price jumps. In May, the West finally broke that streak with a rare price pullback. All regions have recorded strong price gains since May. The regional October price gains were on balance even more breathtaking than September’s: Northeast +20.2%, Midwest +16.7%, South +15.7%, West +15.1%.
Single-family home sales increased 4.1% from September and increased on a yearly basis by 26.7%. I thought August’s small sequential gain might signal a normalization in the market for existing homes. However, the market remains far from normal. Any “normalization” in the short-term will be forced by the limited supply of homes available for sale. The median price of $317,700 was up 16.0% year-over-year.
{video will be posted once available from the NAR}
California Existing Home Sales – October, 2020
The report from the California Association of Realtors (C.AR.) delivered two main highlights: 1) the limited supply of homes for sale are flying off the lot at a record pace, 2) a scarcity in sellers remain constrained sales growth from September to October.
Existing single-family home sales of 484,510 in October fell 1.0% from September but increased year-over-year 19.9%. The median home price of $711,300 was a rare decline of 0.2% from September but still up 17.5% from October 2019. Sales in resorts areas also slowed down sequentially. Sales in these areas continue to outpace sales growth in the state.
San Francisco was the only county in California that actually had a year-over-year drop in price (-1.5%). San Francisco joined San Mateo as the only two counties with year-over-year increases in active listings. Across the state, listings continued to dry up with most other regions losing listings at more than a 40% year-over-year pace. Inventory stayed flat at 16-year lows. The Unsold Inventory Index (UII) plunged from 3.0 to 2.0 year-over-year. The supply constraints are likely now impacting sequential sales growth even as overall demand remains unseasonably strong.
I recently spoke to a realtor about the dynamics of the housing market in the San Francisco Bay Area. I expressed my surprise that households are so ready and eager to make long-term buying decisions in response to what should be a shorter-term impact of the coronavirus pandemic. The realtor explained that the Bay Area housing cycle runs 3-5 years; many people are thinking their decision horizon is good for most of those 3 years.
People are spending a lot more time at home in cramped quarters with kids and spouses working from home. This increased exposure increases the motivation for change. With commuting days gone or greatly reduced for the foreseeable future, a move out to far flung, cheaper suburbs suddenly makes sense. Moreover, with interest rates so low, a mortgage is nearly “free.” These drivers are all adding up to record business and hectic weekends for my realtor friend. She does not see an end to this push coming anytime soon.
New Residential Sales (Single-Family) – October, 2020
New home sales finally took a pause in September and stayed flat month-over-month in October. October sales of 999,000 declined 0.3% from the upwardly revised sales in September of 1,002,000. These sales were still up an astounding 41.5% year-over-year and sit at a 14-year high.
Source: US. Bureau of the Census, New One Family Houses Sold: United States [HSN1F], first retrieved from FRED, Federal Reserve Bank of St. Louis, November 28, 2020.
Median home prices remain in an extended period of stabilization. The median price hit a peak in November, 2017 at $343,400. Since then, it hit a low of $305,400 in January, 2019. In October, the median price slipped ever so slightly by 0.3% from September but still up 2.5% year-over-year. As I have noted in previous posts, this price range is a distinct contrast to the relentless ascent in price for existing homes. It appears the shrinking footprint of new homes has held the median price in check. Of course for existing homes, square footage is slower to change as it requires large-scale turnover in the housing stock.
Source for chart: U.S. Census Bureau and U.S. Department of Housing and Urban Development, New Privately Owned Housing Starts in the United States, Average Square Feet of Floor Area for One-Family Units [HOUSTSFLAA1FQ], retrieved from FRED, Federal Reserve Bank of St. Louis; November 28, 2020.
The monthly inventory of new homes for sale declined from 4.8 in May to 3.4 in August. Inventory declined again in October to 3.3 from 3.6 months of sales in September.
The Northeast was a drag on the sale of new homes in September but led the way in October. The Northeast soared year-over-year by 86.4%. The Midwest surged 51.4%. The South jumped 40.1% year-over-year. The West had the slowest growth of the regions at 35.9%.
Home Builder Confidence: The Housing Market Index – November, 2020
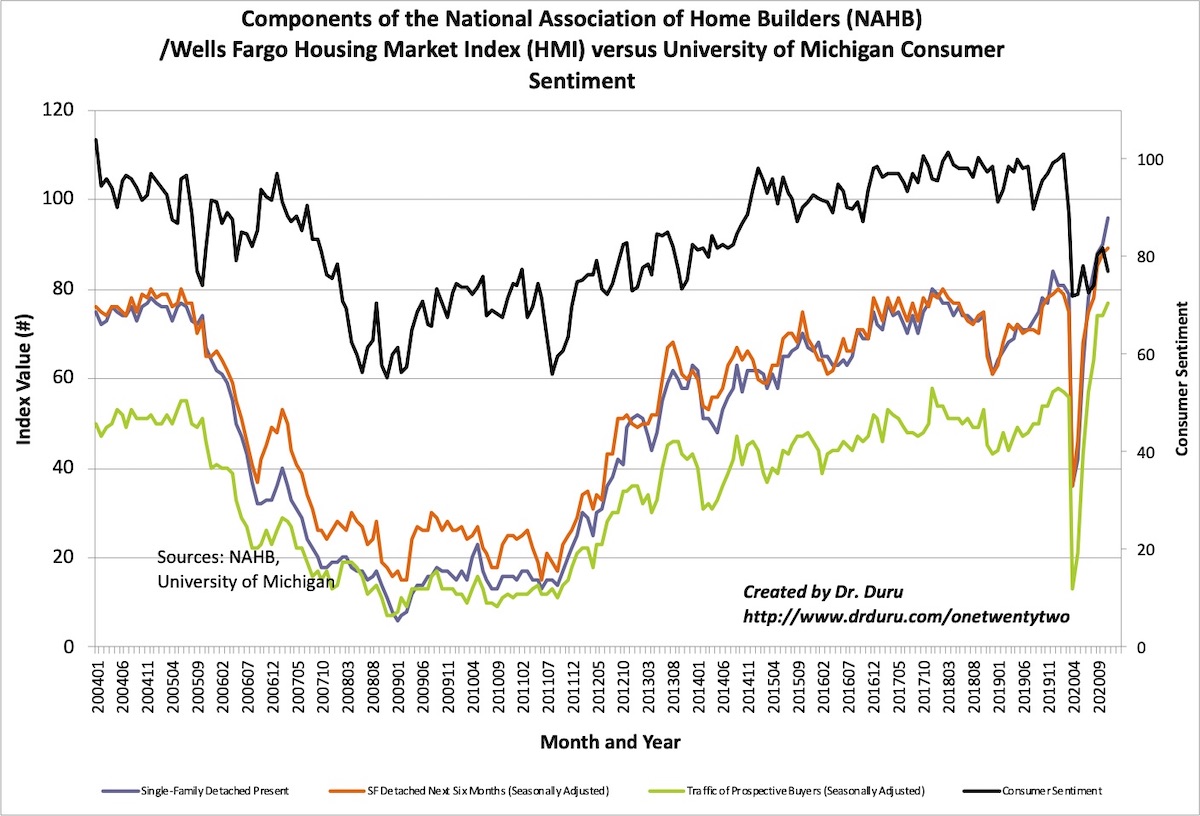
Incredibly, the National Association of Home Builders (NAHB) reported yet one more historic NAHB/Wells Fargo Housing Market Index (HMI). The HMI of 90 in November generated a fourth straight all-time high for builder sentiment. August’s 78 reading tied the former all-time high set in December, 1998.
All three components of the HMI hit all-time highs as well. While the surge in the traffic of prospective buyers stands well above historic norms, the single-family detached present component is now at 96. Clearly builders are unabashedly bullish about housing market conditions. I wonder now whether sentiment can run right past 100.
The NAHB expressed its now familiar concerns about affordability and construction costs. Increasing interest rates made a debut on the list of worries. As these headwinds mount, the shift in demand to “lower density” markets should also increase.
Source for data: NAHB
I am warily eyeing a growing divergence between builder and consumer sentiment. The enthusiasm and cheer from the housing sector is insufficient encouragement for the average consumer. I suspect that consumer sentiment will need to recover and become robust again to provide fresh hope of sustainability for this extremely strong housing market.
In October, builder optimism only pushed sentiment for two of four regions to fresh all-time highs. The Midwest perked up from a small pullback to surge to a new all-time high. The Northeast became a major laggard. At 82, the Northeast’s HMI fell 5 points from the September all-time high. The South surged to from 83 to 90 to another record high. The West pushed higher still to 98.
Home closing thoughts
A Momentous Apology and Strong Affirmation
On November 19th, the National Association of Realtors (NAR) issued a momentous apology in a press release titled “NAR President Charlie Oppler Apologizes for Past Policies that Contributed to Racial Inequality.” The new NAR President declared:
“What Realtors® did was an outrage to our morals and our ideals. It was a betrayal of our commitment to fairness and equality. I’m here today, as the President of the National Association of Realtors®, to say that we were wrong…We can’t go back to fix the mistakes of the past, but we can look at this problem squarely in the eye. And, on behalf of our industry, we can say that what Realtors® did was shameful, and we are sorry.”
Oppler went on to admit “NAR initially opposed passage of the Fair Housing Act in 1968, and at one time allowed the exclusion of members based on race or sex. This discrimination was part of a systematic policy of residential racial segregation, led by the federal government and supported by America’s banking system and real estate industry, and driven by practices like redlining…Many of these discriminatory practices denied the opportunities for families to pass on wealth.”
Fortunately, the NAR has turned over a new leaf. The organization already has its own fair housing initiative. The NAR is also committed to “to examine economic inequality and advance economic inclusion.” This drive is important as homeownership rates continue to exhibit chronic disparaties.
Source: U.S. Census Bureau, Homeownership Rate for the United States [RSAHORUSQ156S], retrieved from FRED, Federal Reserve Bank of St. Louis; December 2, 2020
Be careful out there!
Full disclosure: long KBH shares and short a call, long RDFN puts, long ZG calls