Retail Stocks Underline Market’s V-Shaped Recovery from Calamity – The Market Breadth

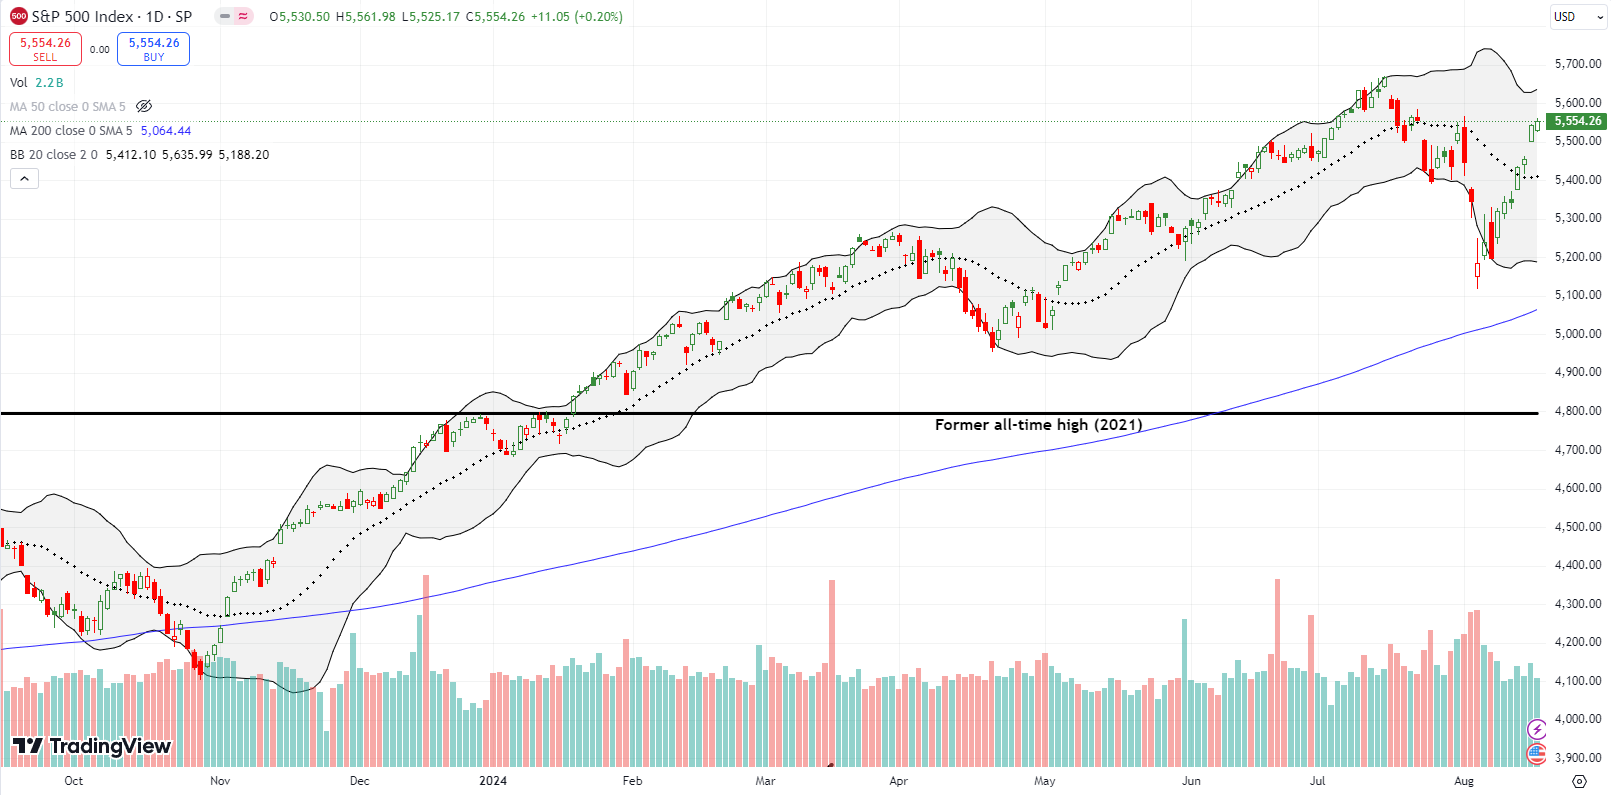
The S&P 500 (SPY) has made a near full recovery back to all-time highs, bouncing back from the early August calamity.

Stock Market Commentary The stock market’s V-shaped recovery finished reversing most of the losses from the August calamity. Small caps are once again the laggards. During this recovery the market swung from recessions fears to recession relief. The prospects for interest rate cuts no longer seemed to matter on either side of the V-shape. The … Read more

A Bear Market Swan Song for the NASDAQ? – The Market Breadth

swan song (Credit: The Song of the Swan 2 by David Hoffman '41)

Stock Market Commentary: Flying on the wings of an AI (artificial intelligence) gold rush, the NASDAQ may have delivered the swan song for its bear market. The latest rush of buying, sent the NASDAQ above its bear market line for the first time since last August. The path to this breakthrough was fraught with yet … Read more

Stocks Wake Up With Key Breakouts – The Market Breadth

wake up with breakouts (Credit: My cat's waking up by jestersgrin on Flickr)

Stock Market Commentary: What was quiet in the prior week is now loud and clear. Led by the NASDAQ, the stock market is in breakout mode. While market breadth is not quite endorsing the move, key breakouts are showing up in the indices and individual stocks. The inability of sellers to take advantage of bad … Read more

Fades Confirmed Bear Market Resistance and Gravity’s Call – The Market Breadth

bear market resistance (credit: ellyn on Flickr)

Stock Market Commentary: The recession that Wall Street wants remains elusive according to the August jobs report. The data show the labor participation rate increased with job growth and a minimal increase in the unemployment rate: a recipe for the (mythical?) economic soft landing. The reaction in the stock market reflected the duality in interpreting … Read more

Stock Chart Reviews: Snapshots of Santa’s Revenge

Stock Market Commentary It was a close call. The technical deterioration of the previous week put the Santa rally in peril. At the start of trading last week, the Grinch roasted Santa enough to ignite oversold trading conditions. Santa’s revenge came in the form of a sharp rebound out of the 1-day oversold period. Subsequently, … Read more

An Overbought Stock Market Stretching Past A Hurting Country – Above the 40 (May 29, 2020)

Stock Market Statistics AT40 = 82.9% of stocks are trading above their respective 40-day moving averages (DMAs) (overbought 4 of last 5 trading days)AT200 = 25.4% of stocks are trading above their respective 200DMAsVIX = 27.5Short-term Trading Call: cautiously bullish (changed from neutral) Stock Market Commentary It feels surreal to write about the latest machinations … Read more

Part Optimism, Part Skepticism from A Partial Trade Deal – Above the 40 (October 11, 2019)

AT40 = 52.4% of stocks are trading above their respective 40-day moving averages (DMAs)AT200 = 48.1% of stocks are trading above their respective 200DMAsVIX = 15.6Short-term Trading Call: cautiously bearish Stock Market Commentary A Broad-Based Re-Entry Two Fridays ago, buyers took the S&P 500 (SPY) back above its 50-day moving average (DMA). It was yet … Read more

Stock Market Stalls At Overbought Threshold As Momentum Stocks Retreat – Above the 40 (September 13, 2019)

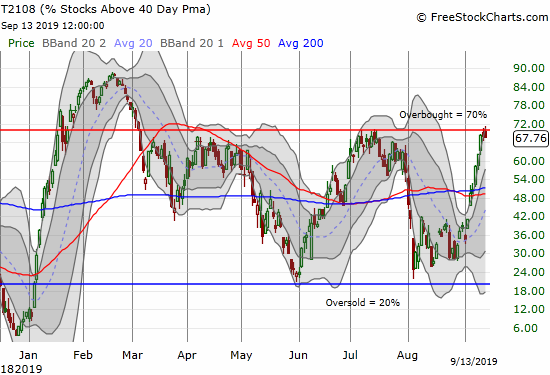
AT40 (T2108) has stalled perfectly at the overbought threshold of 70%.

AT40 = 67.8% of stocks are trading above their respective 40-day moving averages (DMAs) AT200 = 58.8% of stocks are trading above their respective 200DMAs (13-month high)VIX = 13.7Short-term Trading Call: neutral Stock Market Commentary Overbought Overrules Times like these remind me of the significance of the overbought line. AT40 (T2108), the percentage of stocks … Read more

Bearish Resistance Won the Week Against Major Indices – More Churn Ahead: Above the 40 (May 17, 2019)

AT40 = 42.1% of stocks are trading above their respective 40-day moving averages (DMAs)AT200 = 46.4% of stocks are trading above their respective 200DMAsVIX = 16.0Short-term Trading Call: neutral Stock Market Commentary A day after the major indices flipped from bullish support to bearish resistance, buyers rallied these indices through resistance. It was a tenuous … Read more

Above the 40 (August 24, 2018) – S&P 500 Historic All-Time High Shines Cautious Light On Opportunities

AT40 = 60.5% of stocks are trading above their respective 40-day moving averages (DMAs) AT200 = 58.2% of stocks are trading above their respective 200DMAs VIX = 12.0 Short-term Trading Call: neutral Commentary Last week the stock market made history by delivering the longest bull market in history. Tonight on Nightly Business Report, markets are … Read more