
Stock Market Statistics
AT40 = 82.9% of stocks are trading above their respective 40-day moving averages (DMAs) (overbought 4 of last 5 trading days)
AT200 = 25.4% of stocks are trading above their respective 200DMAs
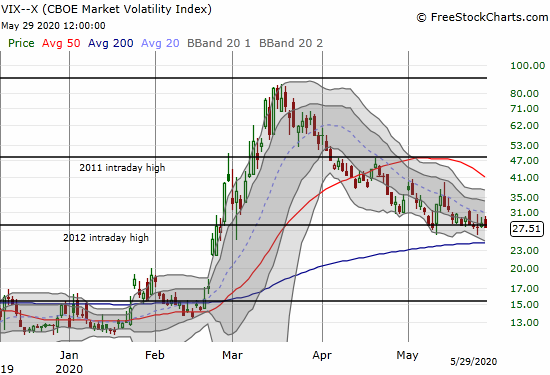
VIX = 27.5
Short-term Trading Call: cautiously bullish (changed from neutral)
Stock Market Commentary
It feels surreal to write about the latest machinations of the stock market while the real economy and the real society hurt and burn. Yet, the stock market has its own logic, and I just try to follow it more than I fight it. I will leave the commentary on the current turmoil in the U.S. with the below tweet I hope readers will interpret as a moment of hope and encouragement.
The Stock Market Indices
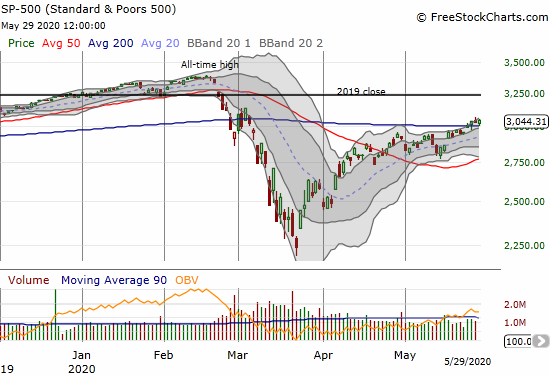
For the second week in a row, the S&P 500 (SPY) started with a resounding gap up. This time, the index popped over 200DMA resistance only to fade for a sub-200DMA close. It was a day for the bulls and the bears. The next day, the S&P 500 gapped up again, sold off, and closed higher for a true 200DMA breakout. Thursday featured a fade from the intraday high. Sellers took the index back to the 200DMA before buyers took control and closed the week at its highest point since March 5th. The week proved out the importance of the 200DMA. With the confirmed breakout the index is in a bullish position and primed to stretch toward all-time highs.
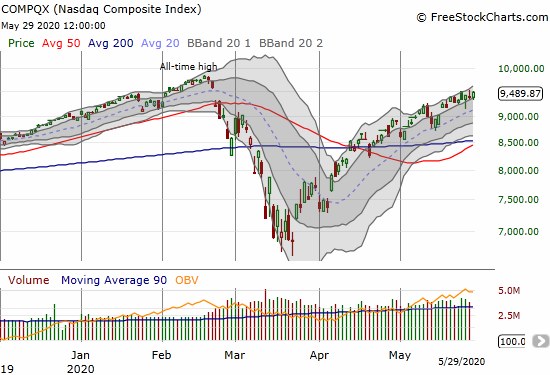
The NASDAQ (COMPQX) continued to power along within its upper Bollinger Band (BB) channel. Amazingly, the NASDAQ is close to filling the gap it left behind in February. That gap down was the prelude to the market crash in March. The NASDAQ’s is now just a 3.4% stretch away from its all-time high. Amazing after what we just went through and will still go through.
Volatility
The volatility index, the VIX, remained resilient all week. The 2012 intraday high continues to be an important pivot. A breakdown of that pivot will put the stock market in an even more bullish position.
Overbought

AT40 (T2108), the percentage of stocks trading above their respective 40DMAs, has been overbought (over 70%), for 7 straight days. This duration counts as an extended overbought rally. The bullishness of this period was underlined and emphasized by the S&P 500 finally joining the NASDAQ in a 200DMA breakout.
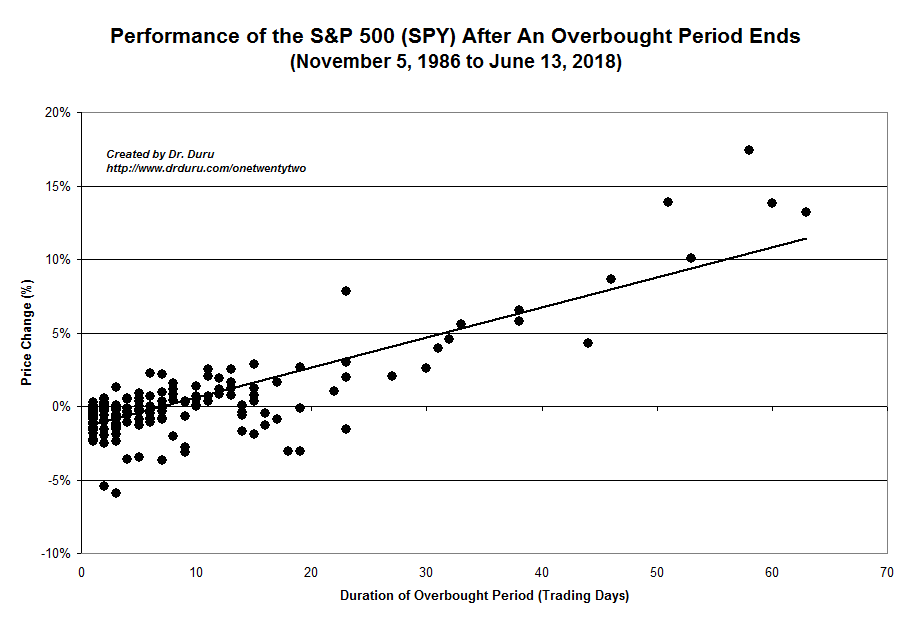
The chart below serves as my guide for thinking through an extended overbought rally. Generally, the performance of the S&P 500 is essentially random between +/-3% up to a 23-day long overbought period. If the overbought period stretches out further, the larger upside potential exists. To the extent the performance of the S&P 500 stretches well above the levels below, I brace for a topping out for the overbought period. The current overbought period started on May 20th. Since the close on that day, the S&P 500 is up 2.4%.
The Short-Term Trading Call
Per my rules, I flipped the short-term trading call from neutral to cautiously bullish thanks to the 200DMA breakout for the S&P 500. I am naturally hesitant to do so because I am wary about the index making a small pivot below the 200DMA. To prevent churning my trading call, I am going to stay cautiously bullish until the NASDAQ and the S&P 500 close below their respective 200DMAs AND AT40 drops out of overbought conditions. Of course one exception would be a blow-off top kind of move in the major indices.
Stock Chart Reviews – Below the 50DMA
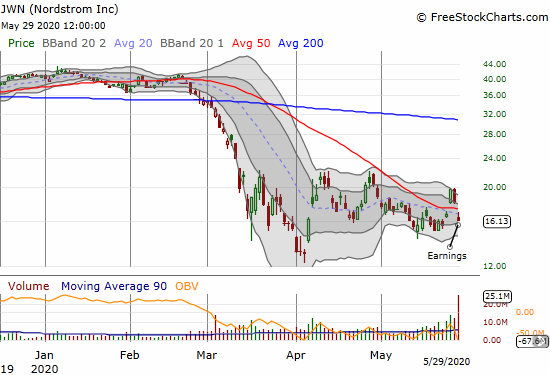
Nordstrom (JWN)
A week ago, I reiterated my wariness about Nordstrom (JWN). A 50DMA breakout ahead of earnings flipped my outlook more positive; the stock gained 16.8%. When the stock dropped 7.7% the next day ahead of earnings, I jumped at the chance to buy the dip. I was even more encouraged that the call options looked “cheap.” The 11.0% post-earnings drop validated the cheapness of those calls. In hindsight, I should have shorted shares as a partial hedge given the upside potential was so high from the calls if they actually paid off.
Stock Chart Reviews – Above the 50DMA
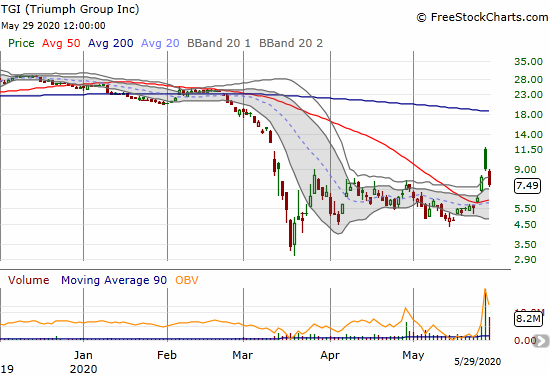
Triumph Group (TGI)
Aerospace company Triumph Group (TGI) is a different kind of cautionary tale about large pre-earnings run-ups. TGI confirmed a 50DMA breakout with a 30.7% gain. TGI soared post-earnings 44.9% at the open, but sellers stepped in right away. TGI closed that day with just an 11.4% gain and created a dramatic gap and crap. Sellers finished the post-earnings reversal the next day with a 17.8% loss. I am now watching to see how the stock behaves at or near its 50DMA.
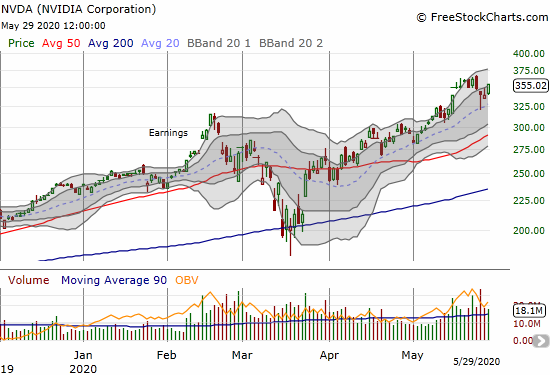
Nvidia Corporation (NVDA)
The real action for Nvidia Corporation (NVDA) was intraday. NVDA opened Friday with a small gap down, rallied a bit, and at one point returned to the intraday low of the day. The stock drifted upward until soaring into the close for the last 60 minutes. NVDA caught my attention when it gained 3% on the day. I took a quick look at the daily and moved into a call spread and a vertical call spread made from weeklies in anticipation of quick buying follow-through.
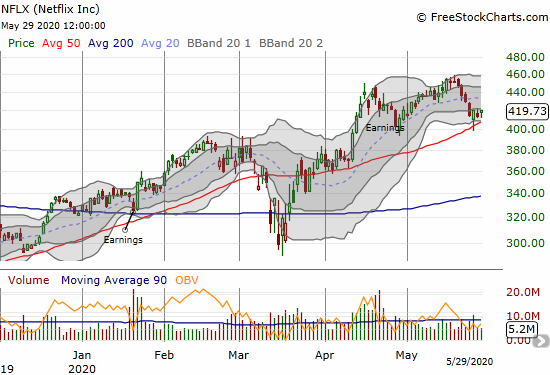
Netflix (NFLX)
Netflix (NFLX) is back on my radar as a short. The stock fell for 5 straight days after its all-time high before it found support at its 50DMA. I am primed to short (most likely with puts), if the stock manages to close below its 50DMA.
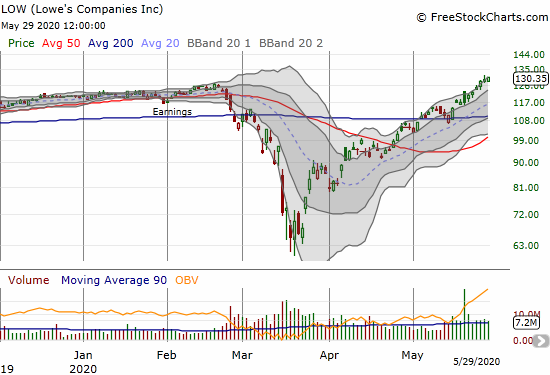
Lowe’s Companies (LOW)
All I can do is lament and shake my head that I am not still sitting in the shares of Lowe’s Companies (LOW) that I bought during the market crash. LOW made new post-crash and then new all-time highs every day last week. LOW is a buy-the-dip play.
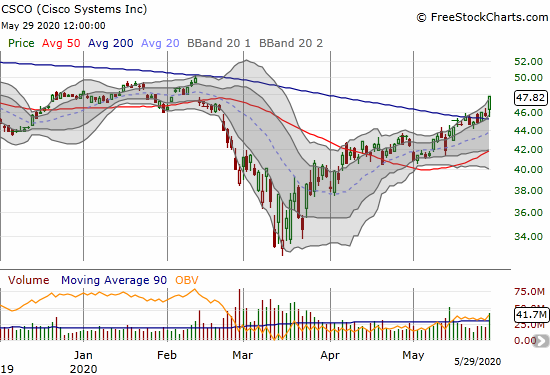
Cisco Systems (CSCO)
Cisco Systems (CSCO) seems to be a forgotten stock in high-tech. Sexier, younger tech companies get all the attention. After the market bought into CSCO’s earnings earlier this month, I decided to jump aboard. CSCO also pays an attractive 3.2% dividend. Friday’s 4.9% gain that confirmed a 200DMA breakout seemed to validate my decision. I am hoping to make CSCO a long-term holding.
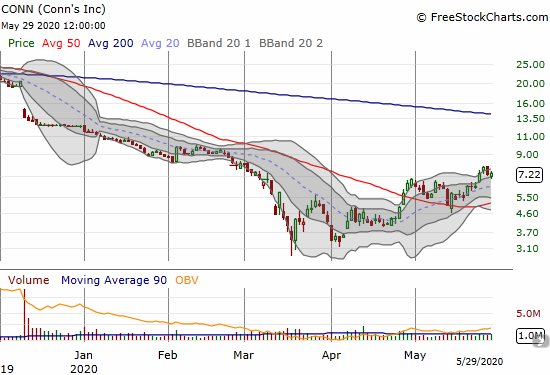
Conn’s (CONN)
Electronics retailer Conn’s (CONN) is somehow still hanging in there. The company reported earnings on April 14th to absolutely no fanfare. After going nowhere for almost a week, the stock suddenly picked up some momentum. With a successful 50DMA test behind it, CONN looked like a buy. I jumped on the small pullback on Thursday as a first opportunity to start accumulating stock.
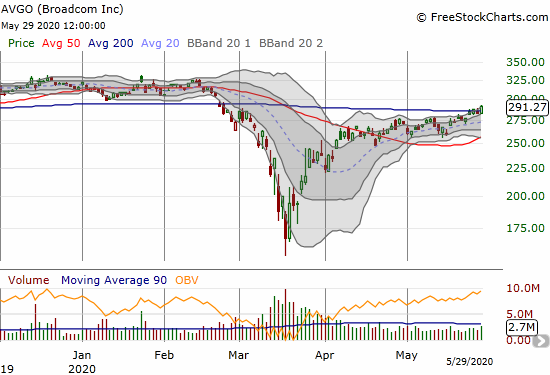
Broadcom (AVGO)
Broadcom (AVGO) created a very constructive period of consolidation from April to May. Friday’s 200DMA breakout is thus coming off a firm base making the stock a solid buy with a tight stop below last week’s lows.
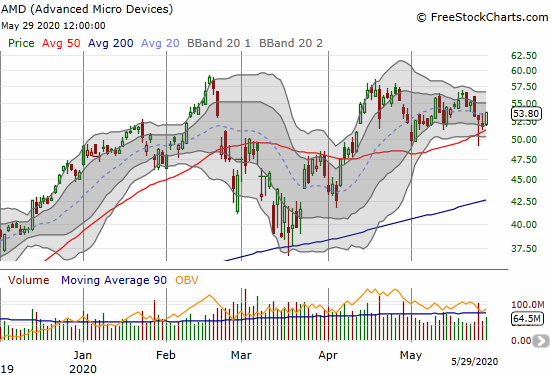
Advanced Micro Devices (AMD)
Advanced Micro Devices (AMD) has churned in a wide range for about 6 weeks. Last week the stock pierced its 50DMA for the first time since April but quickly rebounded. I am looking for one more day of buying to confirm a good risk/reward re-entry for the chipmaker.
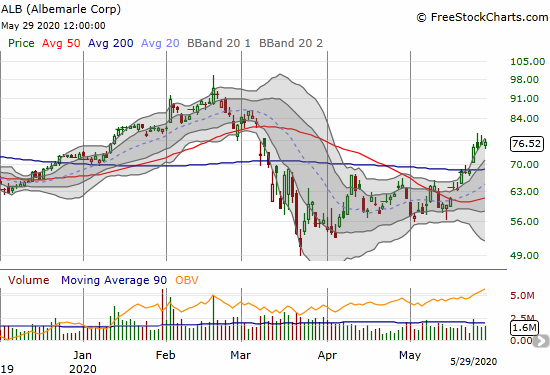
Albemarle (ALB)
Albemarle (ALB) is a specialty chemicals company based in Charlotte, NC. Albemarle provides lithium, bromine specialties, and catalysts. Last week, the stock provided a solid 200DMA breakout. The stock is a buy on the dips with an upside target at February’s highs. Albemarle last reported earnings on May 6th. Investors have clearly taken their time to get bullish on that report.
Stock Chart Spotlight – Bullish Breakout
VMware (VMW)
VMWare (VMW) soared above its 200DMA on Friday with a 9.7% post-earnings gain. This stock is another candidate for the same covered call strategy I initiated with Splunk (SPLK) the previous week. I do not want to tie up yet more capital in such a play so I am looking for a dip to buy into VMW.

— – —
FOLLOW Dr. Duru’s commentary on financial markets via email, StockTwits, Twitter, and even Instagram!
“Above the 40” uses the percentage of stocks trading above their respective 40-day moving averages (DMAs) to assess the technical health of the stock market and to identify extremes in market sentiment that are likely to reverse. Abbreviated as AT40, Above the 40 is an alternative label for “T2108” which was created by Worden. Learn more about T2108 on my T2108 Resource Page. AT200, or T2107, measures the percentage of stocks trading above their respective 200DMAs.
Active AT40 (T2108) periods: Day #33 over 20%, Day #27 over 30%, Day #25 over 40%, Day #24 over 50%, Day #9 over 60%, Day #7 over 70% (overbought 8 of last 9 trading days and 16 of the last 22 days)
Daily AT40 (T2108)
")
Black line: AT40 (T2108) (% measured on the right)
Red line: Overbought threshold (70%); Blue line: Oversold threshold (20%)
Weekly AT40 (T2108)

*All charts created using FreeStockCharts unless otherwise stated
The T2108 charts above are my LATEST updates independent of the date of this given AT40 post. For my latest AT40 post click here.
Be careful out there!
Full disclosure: long SSO shares, long SPLK shares and short a call, JWN call options (most longs left over from calendar call spread), NVDA vertical and calendar call spread, long CSCO, long CONN
*Charting notes: FreeStockCharts stock prices are not adjusted for dividends. TradingView.com charts for currencies use Tokyo time as the start of the forex trading day. FreeStockCharts currency charts are based on Eastern U.S. time to define the trading day.