
AT40 = 60.5% of stocks are trading above their respective 40-day moving averages (DMAs)
AT200 = 58.2% of stocks are trading above their respective 200DMAs
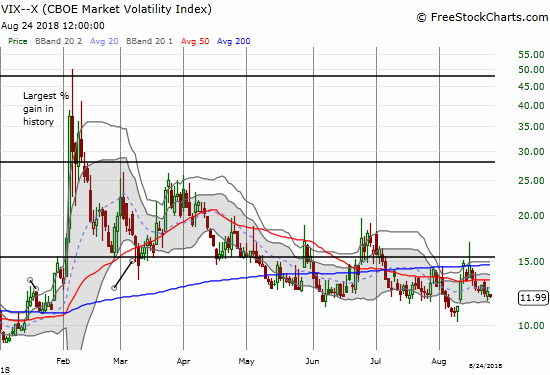
VIX = 12.0
Short-term Trading Call: neutral
Commentary
Last week the stock market made history by delivering the longest bull market in history.
Tonight on Nightly Business Report, markets are on track to record their longest bull run in history. We’ll talk to a market strategist about what could lie ahead for stocks. Join us. pic.twitter.com/l4OoUnRkOS
— NBR (@bizrpt) August 22, 2018
The flex reaction is to say this is a time to sell. Despite the title of the CNBC Fast Money piece below, Professor Robert Shiller cautioned against jumping to that conclusion even though the market does look over-extended in his eyes (as he has said for several years now). As is his form, Shiller danced around some projections and then underlined his disclaimer “I could be wrong.”
Record bull run signals it’s time to sell, says Yale economist Shiller from CNBC.
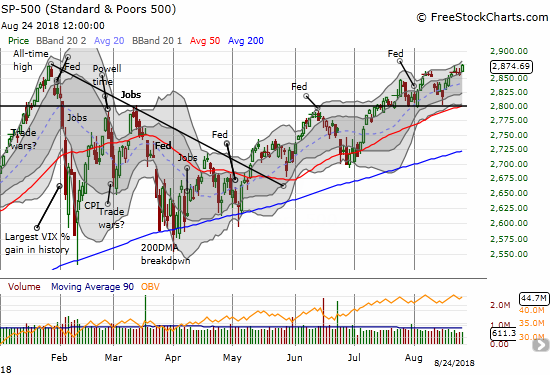
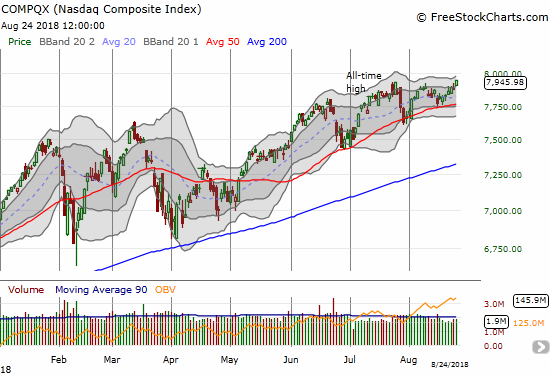
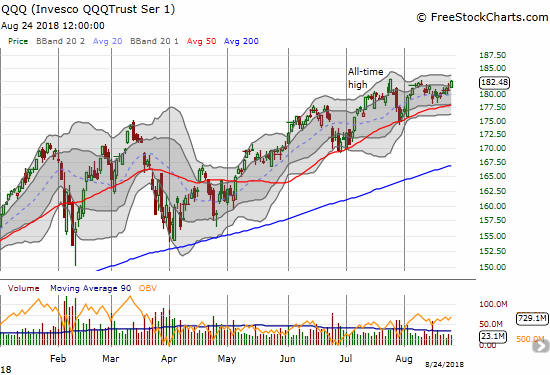
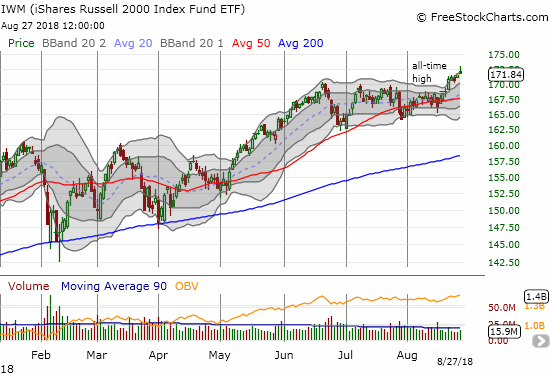
What I see in the charts is encouraging for the short-term although my intuition is struggling to accept it. The S&P 500 (SPY) made its first closing all-time high in over 7 months. The NASDAQ joined in with its own fresh all-time high. The Invesco QQQ Trust (QQQ) is right behind the pack. The iShares Russell 2000 ETF (IWM) broke out to its own new all-time on Tuesday of last week and definitively ended two months of churn.
*August 27, 2018 correction: previous chart was of MTCH
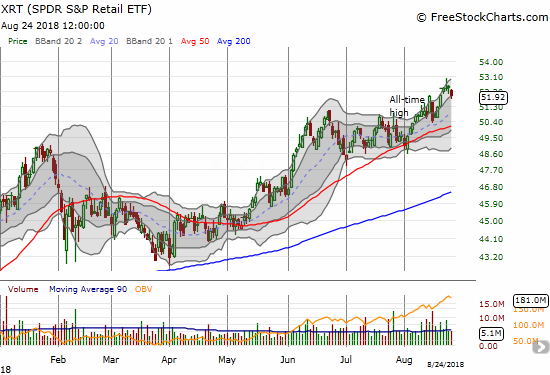
Even retailers have joined the party. While Friday was a down day, the SPDR S&P Retail ETF (XRT) burst to new all-time highs last week. With XRT up a healthy 14.9% year-to-date versus the S&P 500’s 7.5% gain and the NASDAQ’s 15.1% gain year-to-date, 2018 is looking like the year of retail I predicted last year after XRT previously peaked in 2015. I greatly tempered my expectations when XRT broke its February low in March. The ironies are not lost on me, and I am duly noting follow-through on conviction as an area of improvement! (Granted part of my issue is that I was not studying the fundamentals of retail nearly as deeply as I do, say, the home builders).
The volatility index cooperated with the bullish mood by falling back to 12.
AT40 (T2108), the percentage of stocks trading above their respective 40-day moving averages (DMAs), is the one sticking point in this otherwise bullish story (surprise, surprise). My favorite technical indicator looked great on Tuesday when it burst upward to 61.9% and a 2-week high. Unfortunately, it stalled after that and failed to confirm the subsequent all-time high for the S&P 500. AT40’s stalling means that I will stay wary: adding to SPY puts expiring after Labor Day and sticking with the rotation on options betting on the next spike in the VIX. My short-term trading call stays at neutral as I still have no conviction either way. If buyers stay active, AT40 SHOULD push itself close to or into overbought territory by the end of this week. A failure to do so may raise the specter of another bearish divergence.
CHART REVIEWS
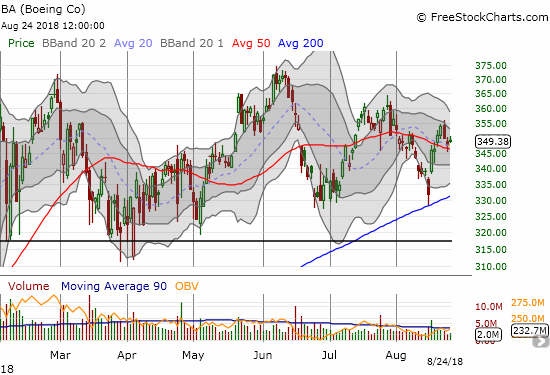
Boeing (BA)
This is a market of perfect technical support. BA pulled off a picture-perfect bounce off 200DMA support on August 15th, and I am glad I put aside my inclination to fade BA rallies to get long with call options. I sold the call options once BA hit 50DMA resistance.
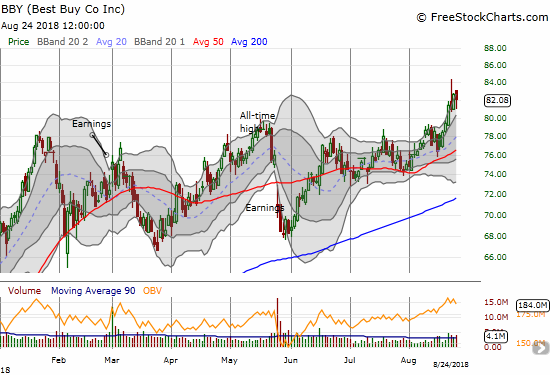
Best Buy (BBY)
BBY is helping lead the charge for retailers. Last week the stock experienced a major breakout to new all-time highs. Earnings on the morning of August 28th will be a major test of the retail story.
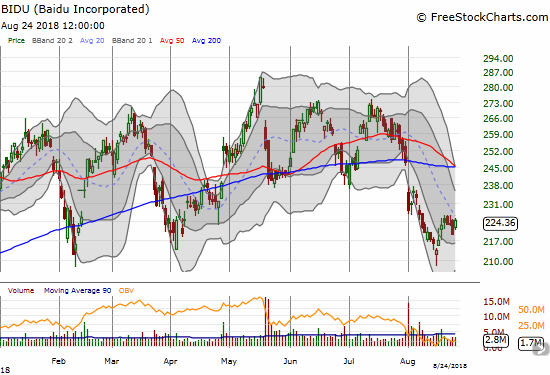
Baidu (BIDU)
BIDU printed a hammer bottom on August 15th and buyers quickly confirmed the pattern. The market’s vicious post-earnings fade of Alibaba (BABA) convinced me to take the small profits on my shares. I am still holding my call spread with an expiration out in September.
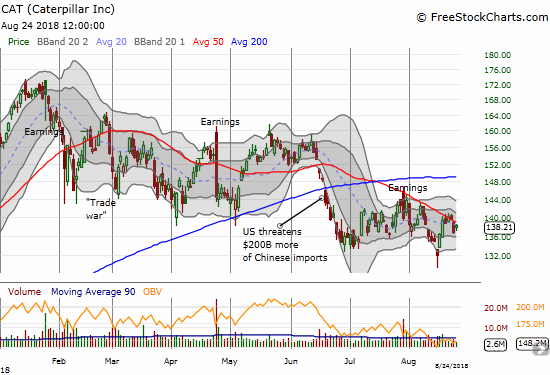
Caterpillar (CAT)
I am back to using CAT as a full hedge on bullishness. While August 15th delivered a relatively convincing bottoming pattern (a kind of hammer), CAT’s 50DMA was equally up to the task of resistance last week.
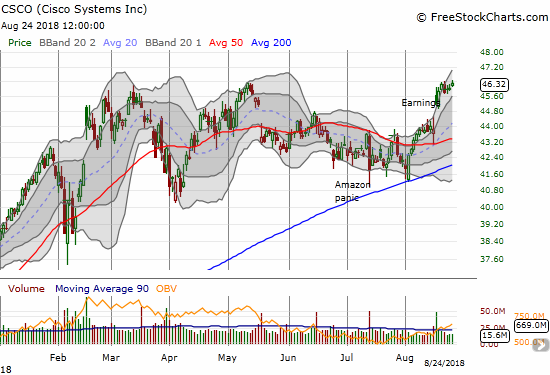
Cisco (CSCO)
I have not looked at CSCO in a LONG time. The company is no longer sexy compared to the other hot growth companies in tech, especially given it remains far off its dotcom heights. Still, with a 3% dividend yield, a post-earnings breakout, and a 14 forward P/E, CSCO looks like the next tech company I want to stuff away in my portfolio. The Amazon Panic trade paid its own (typical) dividends as buyers quickly took CSCO back to 50DMA resistance. It took a picture-perfect 200DMA bounce to firm up CSCO’s bottom and launch into earnings.
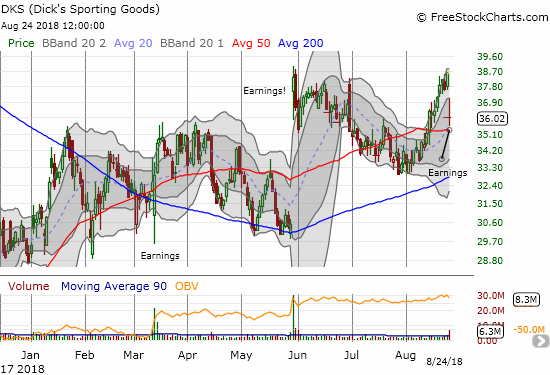
Dick’s Sporting Goods (DKS)
DKS is one of the remaining retailer trades I have continued.
DKS failed to re-establish upward momentum after its latest earnings report. At least it held 50DMA support. I continue to stick with my strategy of buying shares married to covered calls with post-earnings expirations. With a 2.4% dividend yield as a sweetener, I have enjoyed what so far seems like low risk (albeit not exciting) profits.
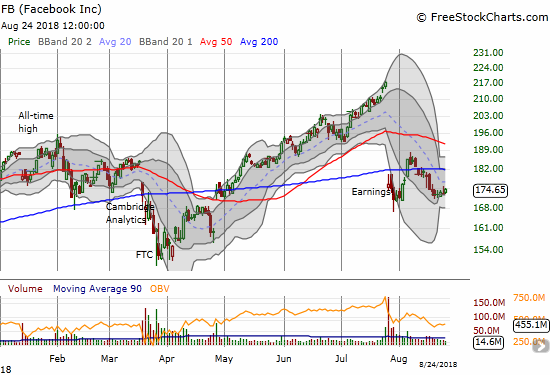
Facebook (FB)
When FB managed to break out above 200DMA resistance, I thought the move signaled the end of the short trade. I rushed back in after it soon broke down. I covered last week after sellers seemed to lose steam. Moreover, I suspect that new highs on the NASDAQ will have the “catch-up” buyers looking for “cheap” shares, and FB looks like a prime candidate.
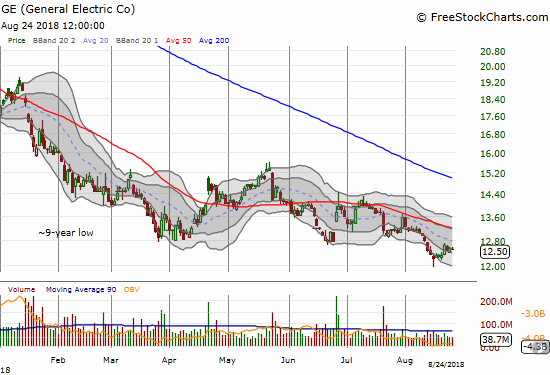
General Electric (GE)
GE still has not bottomed much less broken its persistent downtrend. Yet, I am sticking by the longer-term trade.
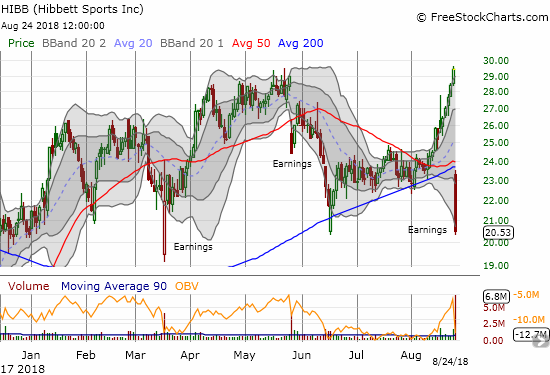
Hibbett Sports (HIBB)
HIBB disappointed the market to the tune of a 30.2% post-earnings drubbing. While this loss was enough for a new 2018 closing low and a 50/200DMA breakdown, the collapse stands in stark contrast to the accelerated expectations that caused the stock to ramp to a 1 1/2 year high ahead of earnings. With 43.5% of the float sold short, this stock will likely continue to be subject to large moves up and down until the company’s story becomes clear one way or the other.
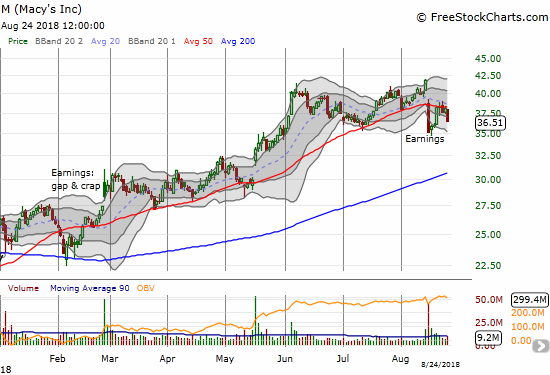
Macy’s (M)
I made the argument that the sell-off in Macy’s was overdone. The stock delivered a picture-perfect rush back to 50DMA resistance. I sold my call options there. The renewed selling pressure has my radar up for the next buying opportunity.
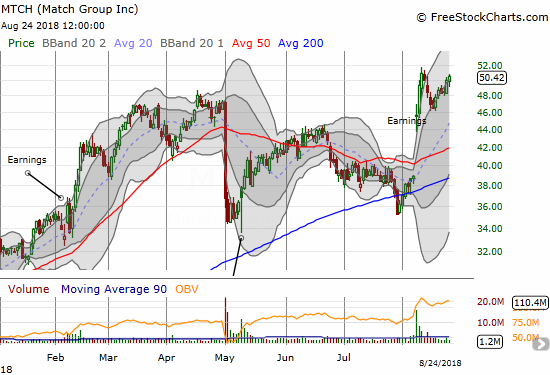
Match.com (MTCH)
49.0% of MTCH’s float is sold short. Clearly a LOT of skepticism exists out there about the viability of online dating. MTCH’s last earnings report helped propel the stock to a major breakout and a series of fresh all-time highs. The pullback to the bottom of the upper-Bollinger Band (BB) channel was a great swing trade entry point that I missed. This stock looks strong enough to buy the next breakout, so I am on alert.
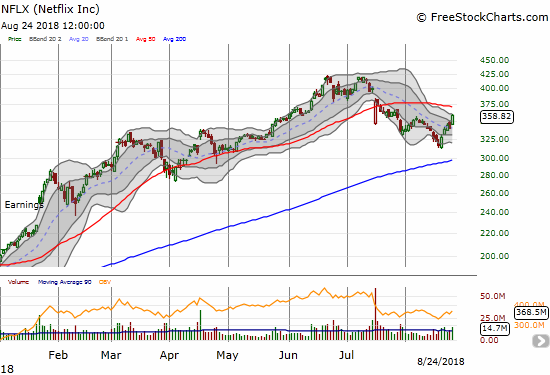
Netflix (NFLX)
I have argued for a top in NFLX since it gapped down from its last all-time high in June. That call paid well until analysts covered the stock last week in major upgrades. I was too slow in recognizing the bottom as I started with a very conservative calendar call spread on Monday. NFLX quickly blew through my strike, so on Friday I switched to a call spread with a put spread as a hedge. Incredibly, NFLX blew right past the top of the call spread for good measure. I am trying not to think of all the profits left on the table from making this trade off the bottom overly complicated. NFLX gained 13.3% on the week.
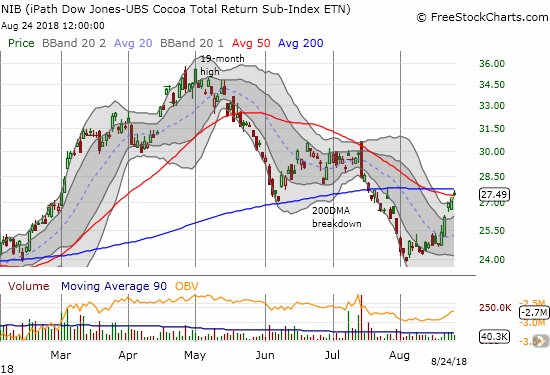
iPath Bloomberg Cocoa SubTR ETN (NIB)
Troubles in the financial sector in the Ivory Coast are threatening the country’s ability to export cocoa. I believe this latest drama for the West African country and cocoa’s largest producer are helping to propel the price of cocoa off recent lows. This surprise rally caught me just one tranche short of rebuilding my long position in NIB. I was tempted to take profits on Friday with NIB at 200DMA resistance, but I decided to wait for at least one more day to see whether momentum can propel NIB to a gap up higher. I think I have enough cushion to salvage profits if NIB instead sells off from resistance.
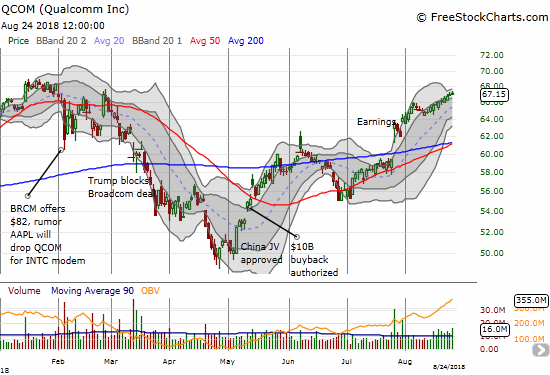
Qualcomm (QCOM)
Buyers followed through on QCOM’s breakout. While the progress has been very consistent, it has happened in reluctant drips. With the stock closing in on recent highs, I decided this spot makes sense for profit-taking. I closed out my shares and call options.
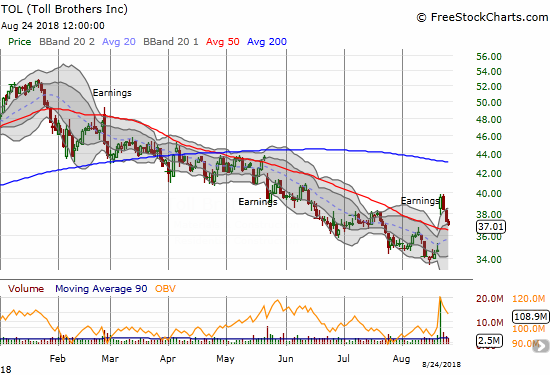
Toll Brothers (TOL)
TOL brothers finally got the market excited about yet another strong earnings report. It is hard for me to understand why THIS time is different, but I am guessing Redfin (RDFN) so effectively set up the market for pessimism that TOL’s good news looked like major relief. A bunch of over-eager short sellers likely got caught leaning the wrong way as well. I find it telling that the latest round of disappointing housing data pushed TOL right back down toward 50DMA support. I will have a lot more to say about the data in my next Housing Market Review. I also hope to marry that with a review of the specifics of TOL’s earnings.
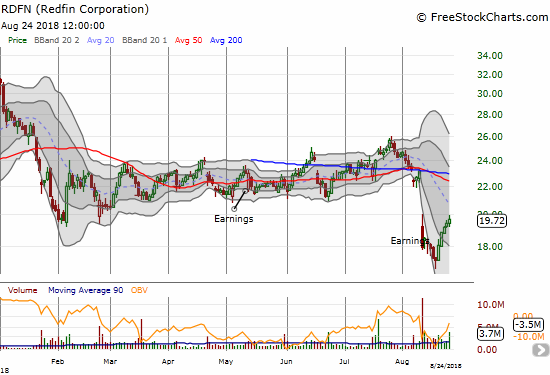
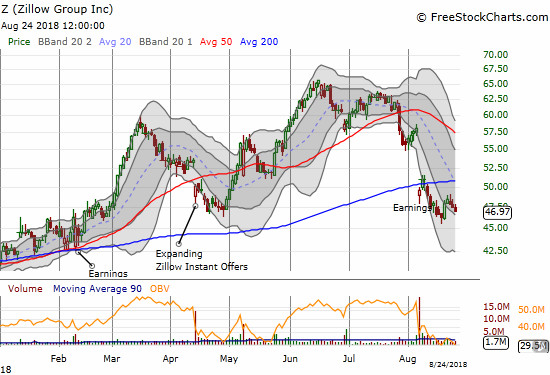
Redfin (RDFN) and Zillow Group (Z)
My long RDFN and short Z pairs trade worked out much more quickly than I could have expected. A bounce off the lows for both stocks was further helped by a (surprisingly) strong reaction to the latest earnings report from Toll Brothers (TOL). While Z followed TOL back down, RDFN kept zipping higher. I decided to take profits on the RDFN call options as the sharp V move does not look sustainable. I am now monitoring the Z puts for an exit.
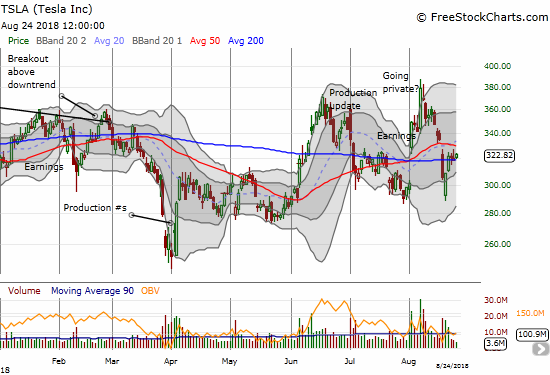
Tesla (TSLA)
The “$420 or bust” trading scenario for TSLA took on another twist after Elon Musk effectively admitted he never had funding secured to go private at $420. In a post late Friday titled “Staying Public“, Musk explained his reasoning for staying public:
“Given the feedback I’ve received, it’s apparent that most of Tesla’s existing shareholders believe we are better off as a public company. Additionally, a number of institutional shareholders have explained that they have internal compliance issues that limit how much they can invest in a private company. There is also no proven path for most retail investors to own shares if we were private. Although the majority of shareholders I spoke to said they would remain with Tesla if we went private, the sentiment, in a nutshell, was “please don’t do this.”
I knew the process of going private would be challenging, but it’s clear that it would be even more time-consuming and distracting than initially anticipated. This is a problem because we absolutely must stay focused on ramping Model 3 and becoming profitable. We will not achieve our mission of advancing sustainable energy unless we are also financially sustainable.”
Knowing that this decision would make him look like a liar about “funding secured”, Musk added this bullet: “That said, my belief that there is more than enough funding to take Tesla private was reinforced during this process.” I am not sure whether the SEC will accept this explanation when it concludes its investigation into violations of disclosure rules. “Belief” does not equate to financial commitments and term sheets that support a factual public disclosure.
Regardless, the $420 upside target is now completely off the table. Now “bust” is a bigger part of the trade scenario than I like. Last Monday, TSLA gapped down and recovered quickly. I took advantage of that gap down to add more shares, but I did not take profits on my put spread. Now I wish I did take those profits as they could have provided a decent cushion for a likely return of renewed selling pressure on TSLA.
Musk cleverly released his “stay public” news after markets closed on Friday. That late release avoids trigger-happy reactions and quick-fire trading algorithms. Cooler heads have time to collect themselves over the weekend. Still, even if TSLA survives another week of selling pressure, I am not sure I want to stick around for the inevitable round of fundraising the company has to do to finance its aggressive production targets.
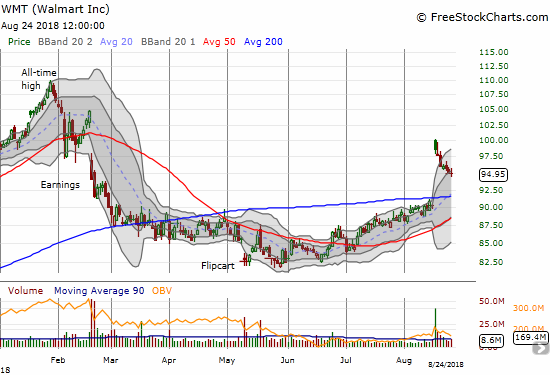
Walmart (WMT)
WMT created major headlines when it reported earnings a week and a half ago. The historic move on the stock helped propel XRT higher. The stock gapped up right to $100 and stopped cold. Sellers have not stopped since then. The selling is starting to slow and setting up a potential “calm after the storm” buying opportunity. I check on WMT every day right now.
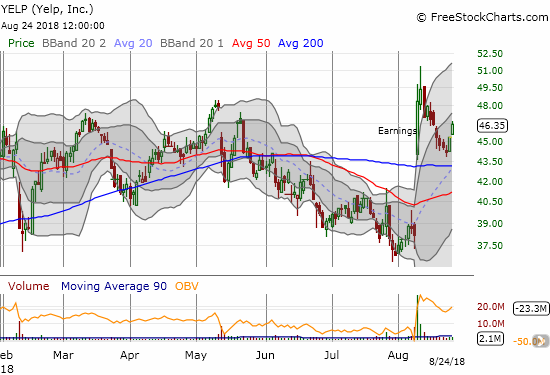
Yelp (YELP)
YELP is a great example of the gains to be had after a post-earnings pullback runs it course. While I had YELP on my radar, I let it slip after the first buying pattern failed to confirm. While my eyes were off the ball, I missed the easy pitch right over the middle on Thursday as buyers returned in force. I also missed Friday’s convincing follow-up buying. So while I keep a close watch on WMT, I will be in accumulation mode on YELP. The support at the 200DMA provides a natural floor for a stop-loss.
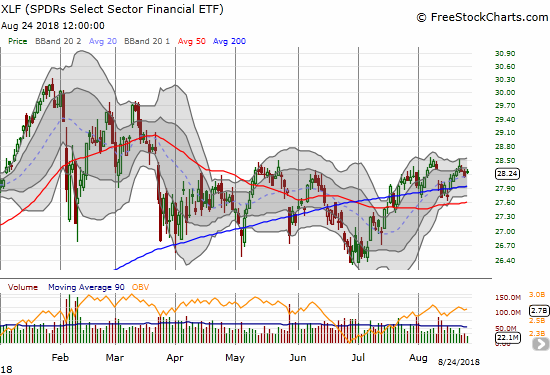
Financial Select Sector SPDR ETF (XLF)
Financials are still getting left behind by the major indices. I continue to wonder and worry about this lagging performance. XLF is at least above its 200DMA support, so I am trying not worry too much. But still…
— – —
FOLLOW Dr. Duru’s commentary on financial markets via email, StockTwits, Twitter, and even Instagram!
“Above the 40” uses the percentage of stocks trading above their respective 40-day moving averages (DMAs) to assess the technical health of the stock market and to identify extremes in market sentiment that are likely to reverse. Abbreviated as AT40, Above the 40 is an alternative label for “T2108” which was created by Worden. Learn more about T2108 on my T2108 Resource Page. AT200, or T2107, measures the percentage of stocks trading above their respective 200DMAs.
Active AT40 (T2108) periods: Day #130 over 20%, Day #99 over 30%, Day #94 over 40%, Day #7 over 50%, Day #1 over 60% (overperiod ending 32 days under 60%), Day #50 under 70% {corrected 8/27/18}
Daily AT40 (T2108)
")
Black line: AT40 (T2108) (% measured on the right)
Red line: Overbought threshold (70%); Blue line: Oversold threshold (20%)
Weekly AT40 (T2108)

*All charts created using freestockcharts.com unless otherwise stated
The charts above are my LATEST updates independent of the date of this given AT40 post. For my latest AT40 post click here.
Related links:
The AT40 (T2108) Resource Page
You can follow real-time T2108 commentary on twitter using the #T2108 or #AT40 hashtags. T2108-related trades and other trades are occasionally posted on twitter using the #120trade hashtag.
Be careful out there!
Full disclosure: long CAT puts and put spreads, long DKS shares and short call, long GE calls, long NIB, long TSLA call spreads and shares, long Z puts, long SPY puts, long UVXY call options
*Charting notes: FreeStockCharts.com stock prices are not adjusted for dividends. TradingView.com charts for currencies use Tokyo time as the start of the forex trading day. FreeStockCharts.com currency charts are based on Eastern U.S. time to define the trading day.
Correction on QCOM positioning: I still had call options open. I took those profits today at the time of writing (August 27, 2018).
Correction: DKS did not report earnings. Earnings will be on August 29th. The gap down was a drop in sympathy with the post-earnings disaster from HIBB.