Stock Market Commentary:
What was quiet in the prior week is now loud and clear. Led by the NASDAQ, the stock market is in breakout mode. While market breadth is not quite endorsing the move, key breakouts are showing up in the indices and individual stocks. The inability of sellers to take advantage of bad news over the past two months has acted like a wake-up call to buyers rushing into the gap. Even the anachronistic adage of “sell in May” is failing to motivate more pessimism. Bears and sellers are left with the manufactured emergency in the debt ceiling drama as a last shred of hope before the summer of 2023 becomes a summer of loving stocks.
The Stock Market Indices
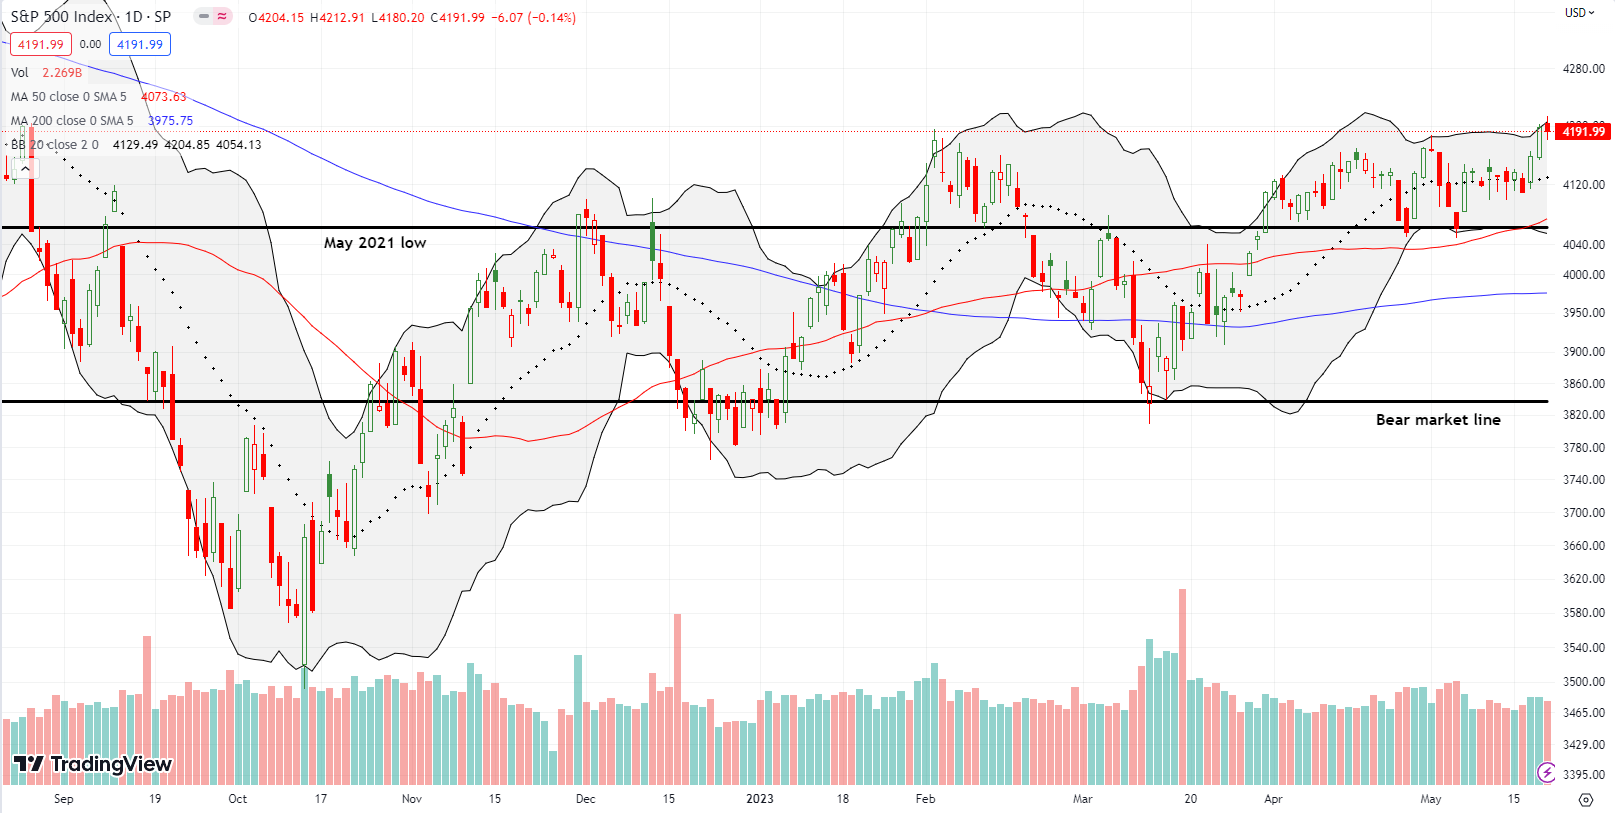
The S&P 500 (SPY) is sleepy no more. The market breakouts nudged the index over the February high. Friday’s tiny pullback closed the S&P 500 for the week just below where it closed right before Federal Reserve chair Jerome Powell smacked down the stock market at Jackson Hole last August. The S&P 500 is one higher close away from confirming its break from a 6-week trading range that at times fell comatose. Needless to say, the put spread I watched twice flip from profits to losses expired completely toasted (poor trade management!).
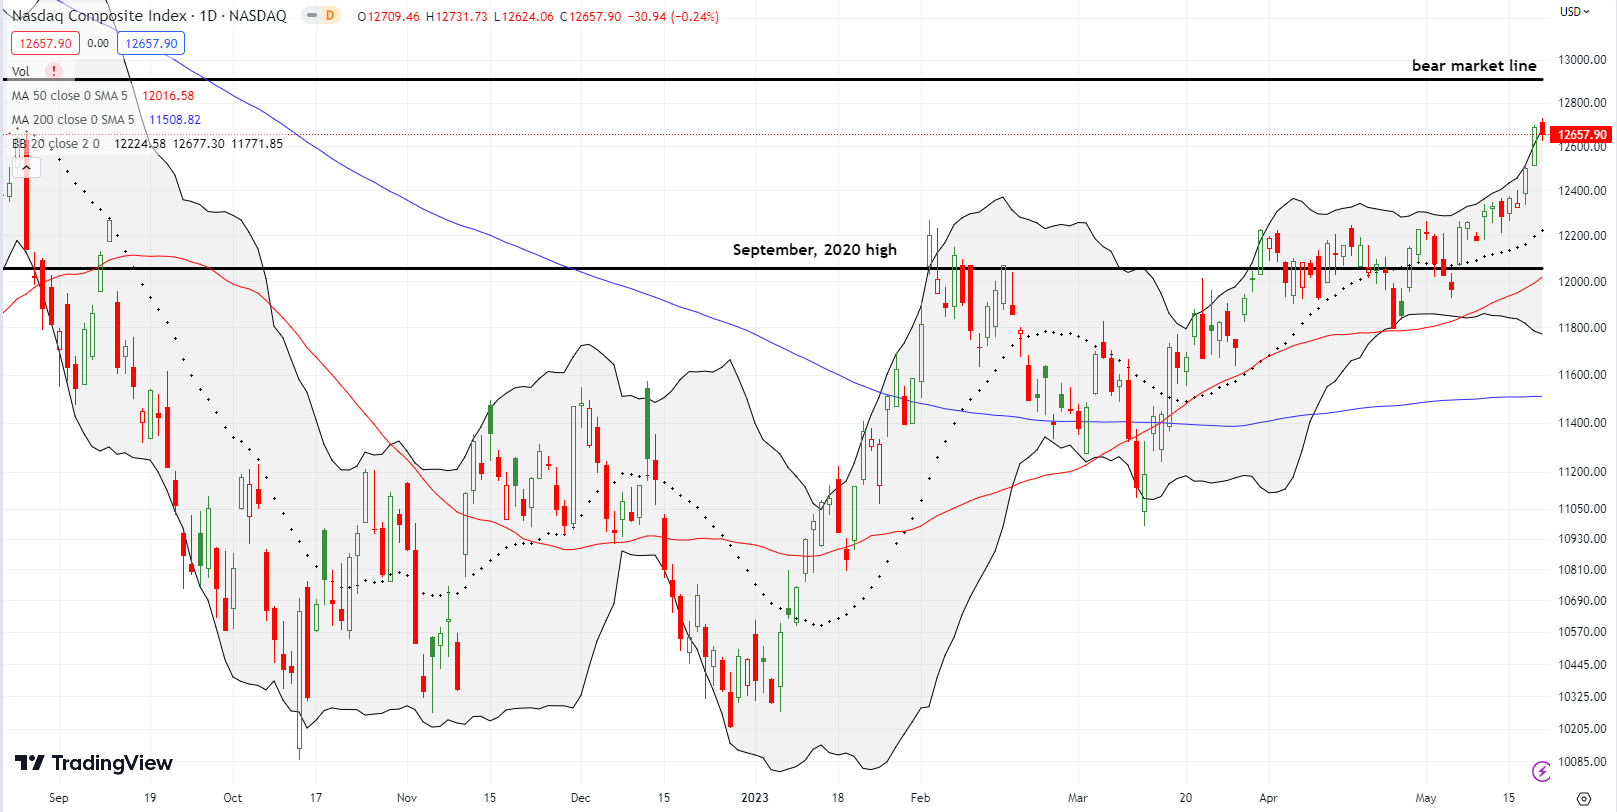
The NASDAQ (COMPQ) is in clear breakout mode. Friday’s small pullback put the brakes on a growing parabolic move, but the tech laden index still looks determined to test its bear market line for the first time since last August. For now, the pre Jackson Hole price is acting like a magnet for the NASDAQ.
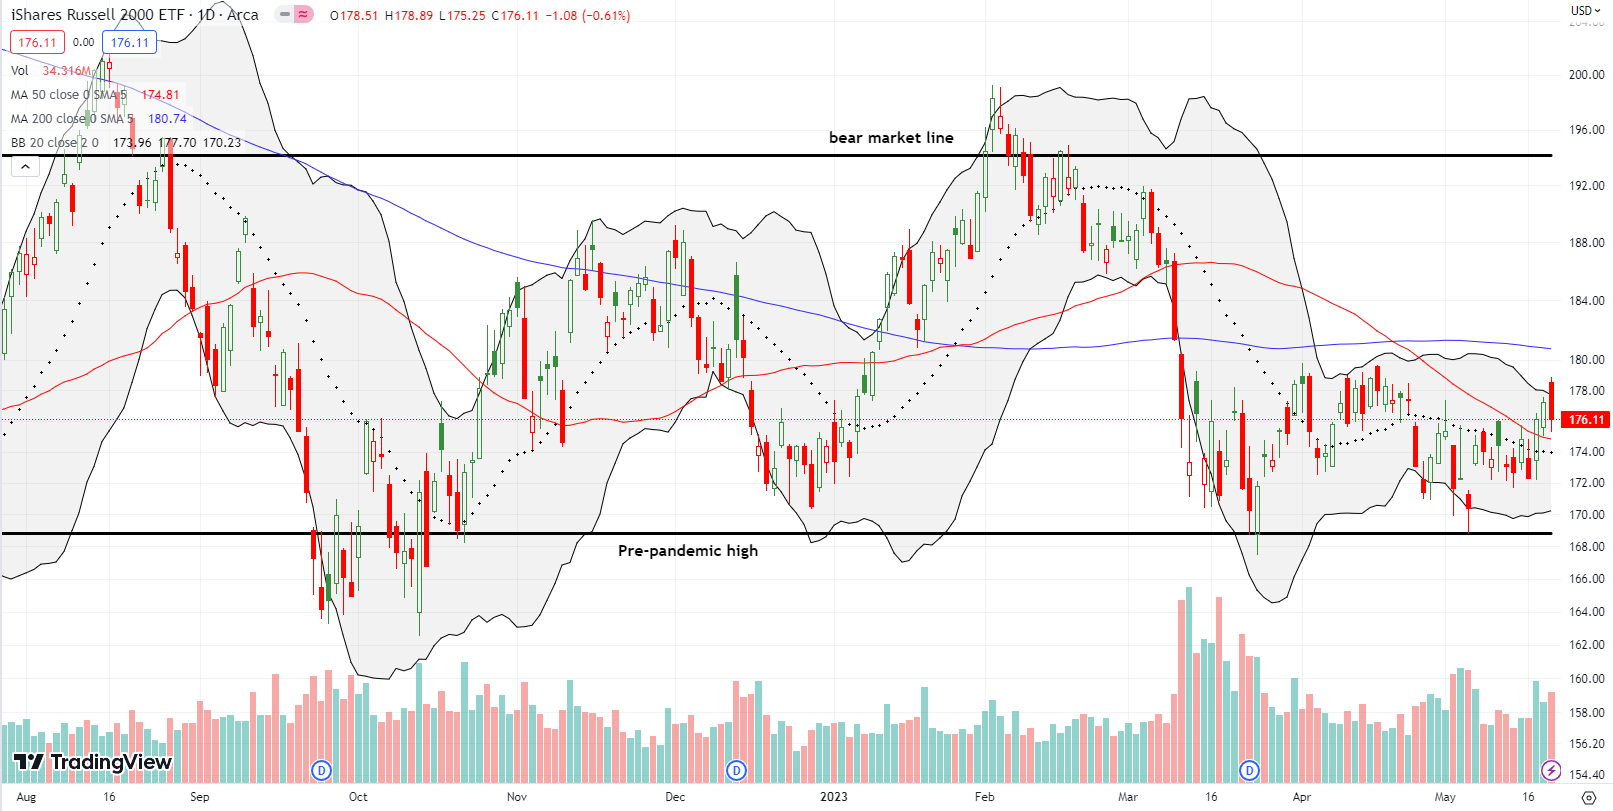
Even the iShares Russell 2000 ETF (IWM) got a wake-up call. In just two days, the ETF of small caps confirmed breakouts above its 20-day moving average (DMA) (the dotted line) and the 50DMA. Friday’s 0.6% loss kept IWM capped, so buyers of small caps still have a lot to prove. A breakout above 200DMA resistance (the bluish line) will be bullish for IWM.
Stock Market Volatility
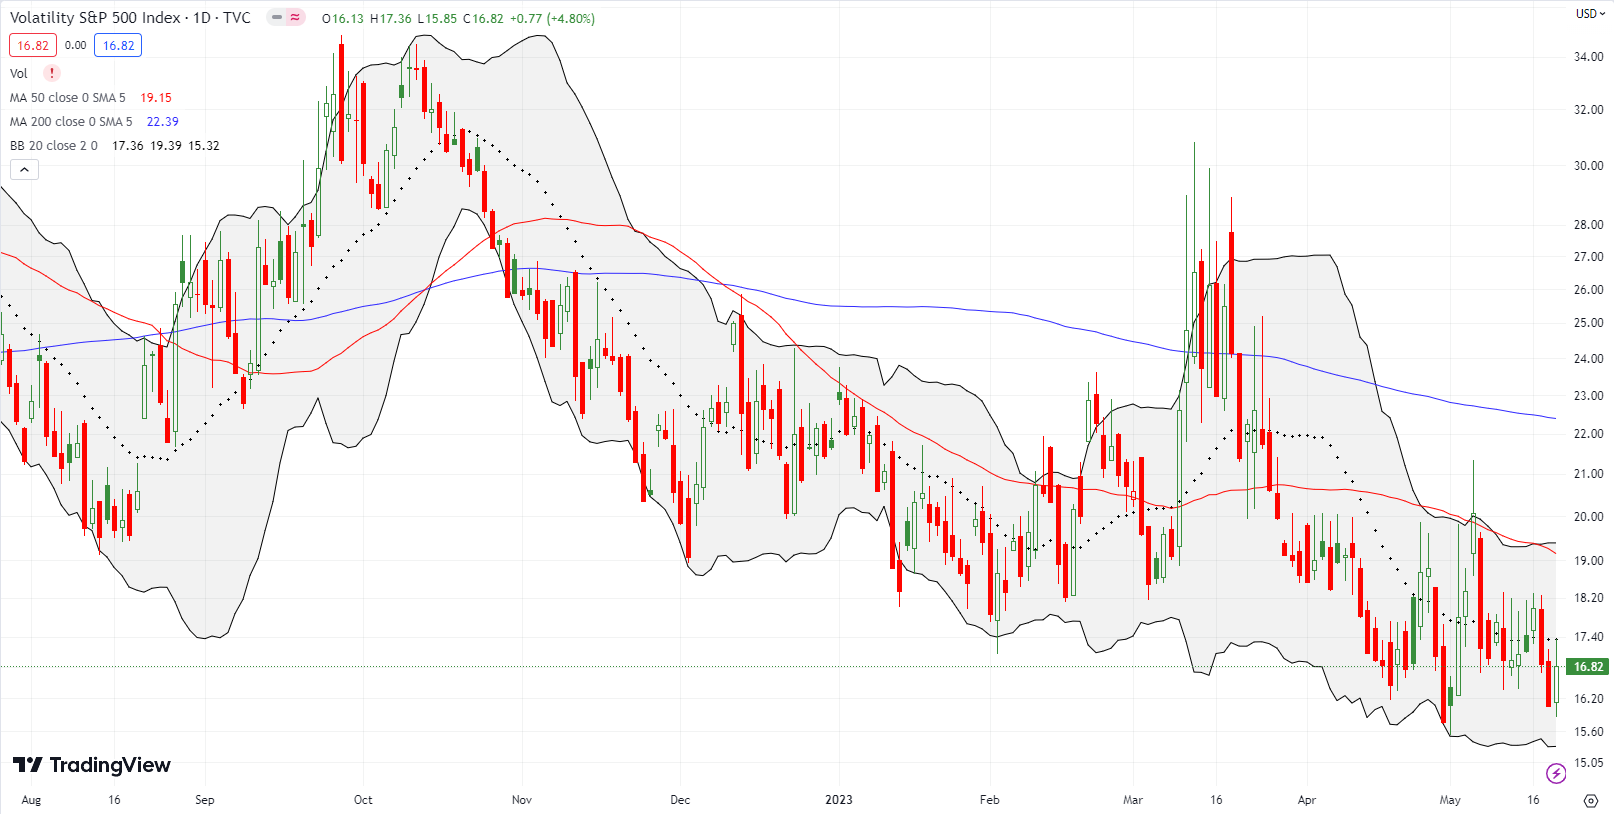
The volatility index (VIX) got a wake-up call on Friday as the debt ceiling drama shook the edge off complacency. Still, the VIX is flirting with undercutting its low for the year. If you harbor lingering fears about the stock market, this is still a time to buy protection on the cheap. I remain focused on fading the VIX after the next surge.
The Short-Term Trading Call With Breakouts
- AT50 (MMFI) = 47.6% of stocks are trading above their respective 50-day moving averages
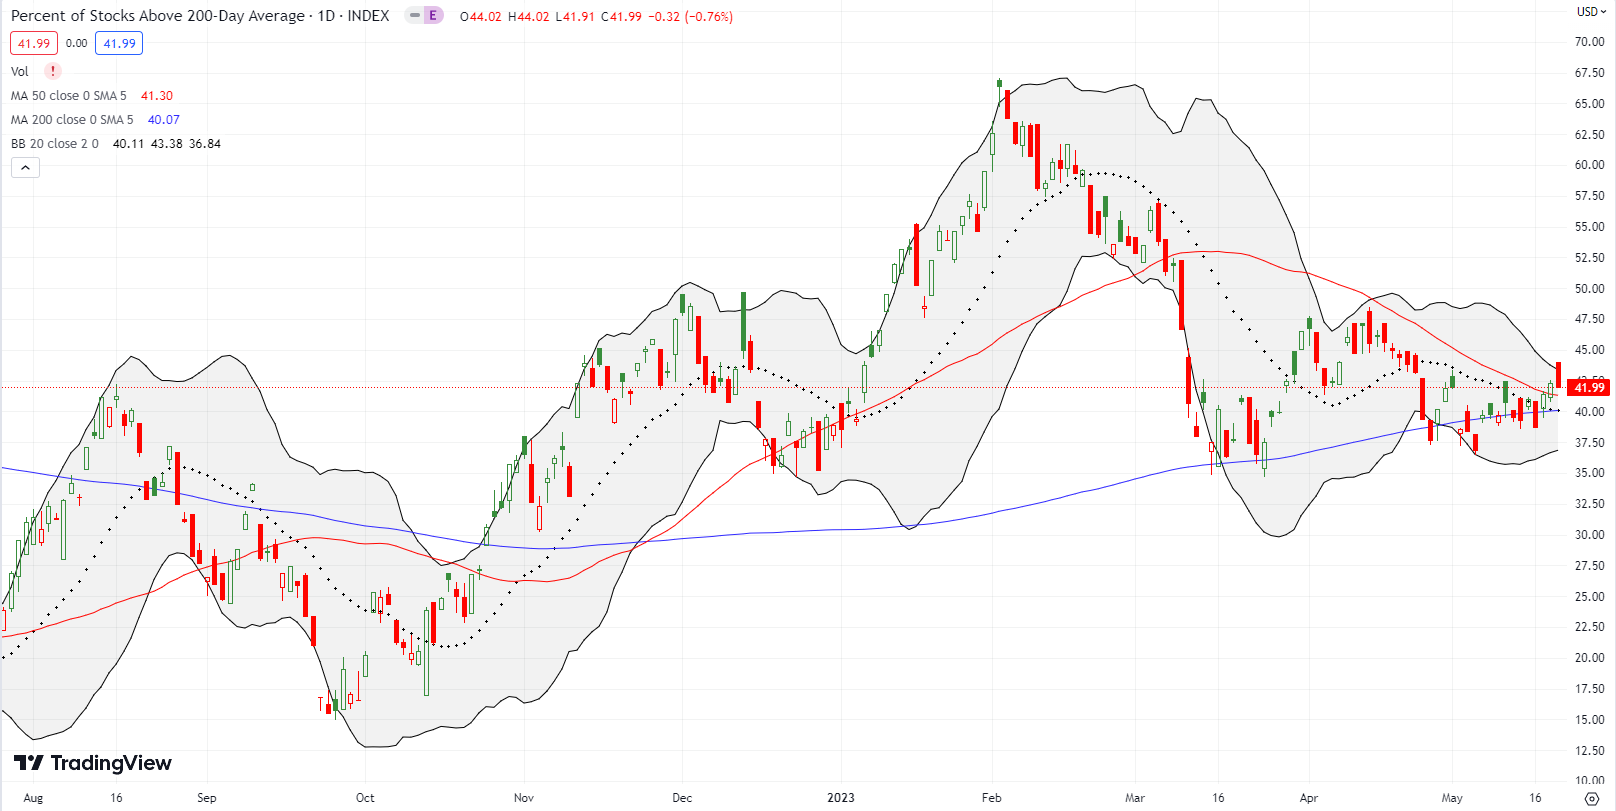
- AT200 (MMTH) = 42.0% of stocks are trading above their respective 200-day moving averages
- Short-term Trading Call: cautiously bullish
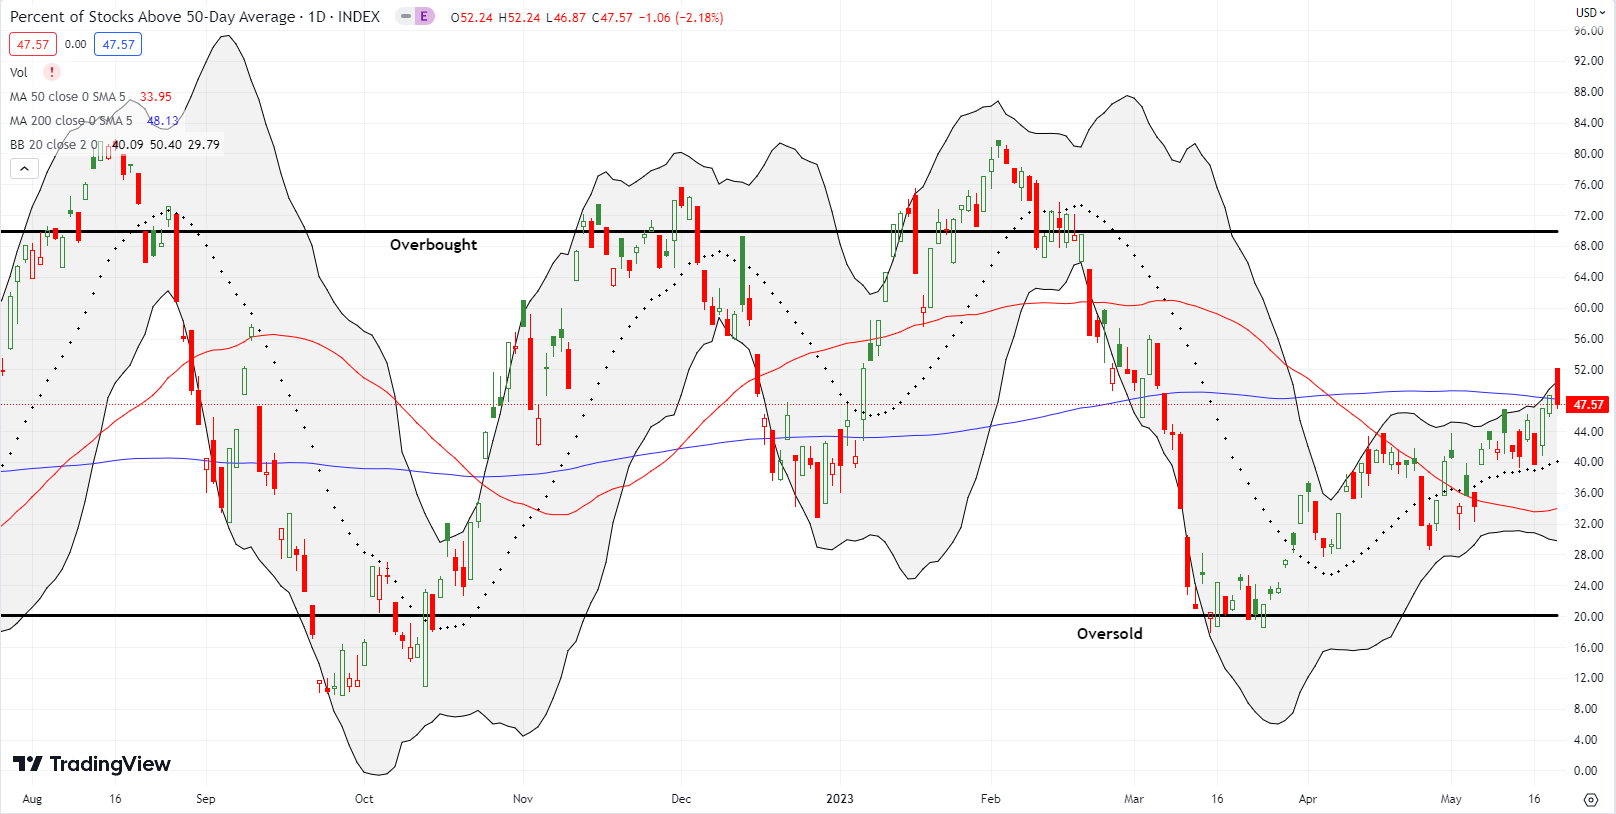
AT50 (MMFI), the percentage of stocks trading above their respective 50DMAs, closed the week at 47.6%. Friday’s selling pressure prevented my favorite technical indicator from adding its approval to the stock market’s breakouts. AT50 gapped up to 52% before ending the day with a net 1% point loss. I SHOULD take this fade as a point of caution. Instead, I am sticking my neck out and upgrading my short-term trading call from neutral to cautiously bullish. Given the number of breakouts I keep seeing in individual stocks, an upgrade puts me in a better mindset to buy these breakouts and/or buy the dips to come in the stocks with the breakouts. The market’s sleepwalking is apparently coming to an end.
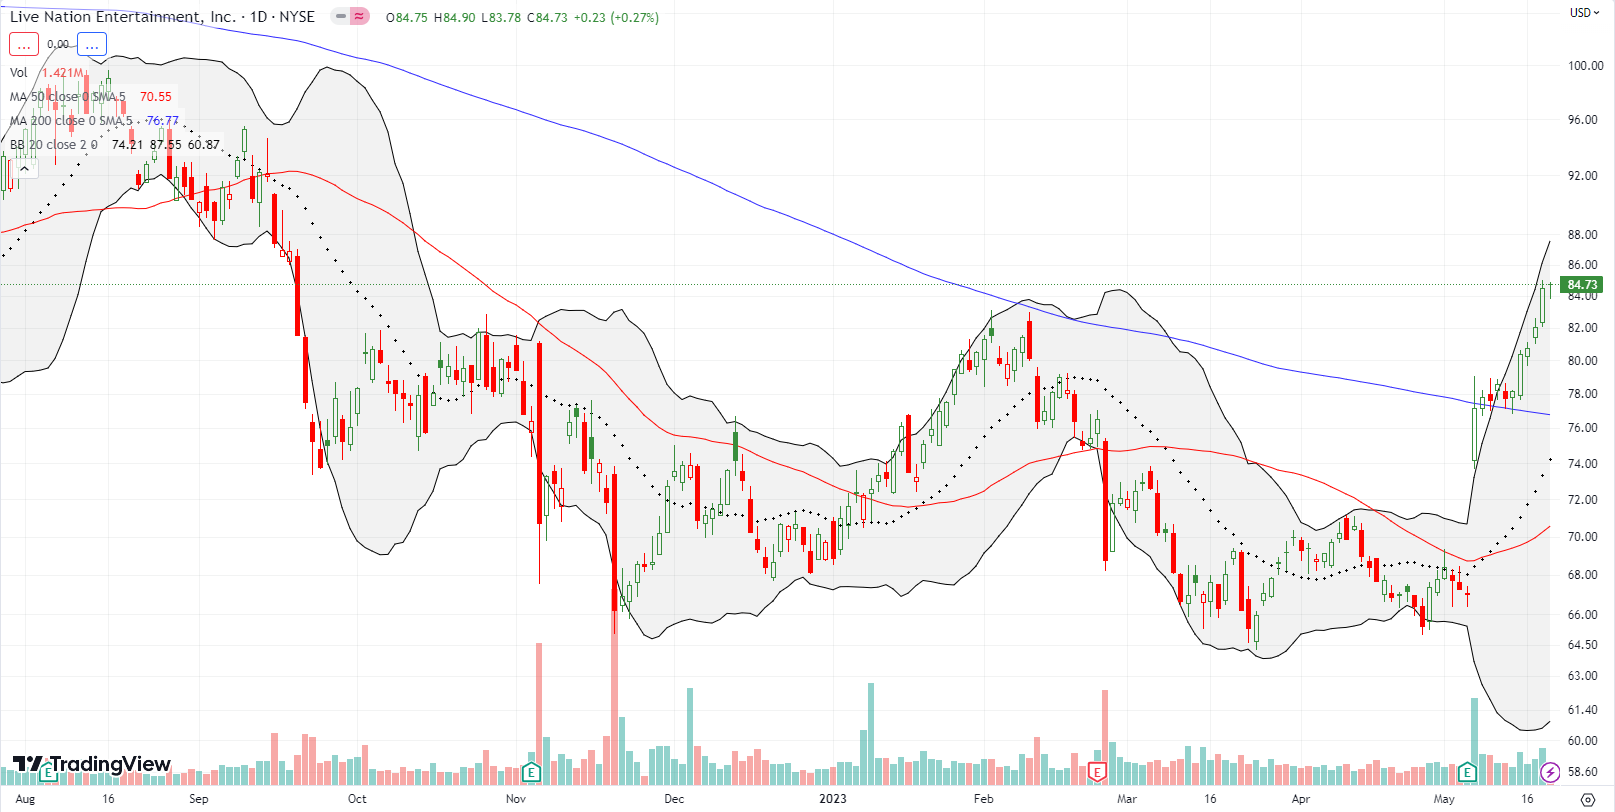
Live Nation Entertainment (LYV) is a classic case in point for my changed mindset. I have long been bearish on LYV, so I did not hesitate to fade the stock on its post-earnings surge into 200DMA resistance. After subsequent closes above the 200DMA, I sniffed trouble and took my small loss. The next day, LYV broke out again. Quickly, I flipped my script into a call option. I took profits on Thursday. The buying pressure here looks strong, and I fully expect more upside ahead. However, the stock needs to “cool off” to lower the downside risk of a short-term trade.
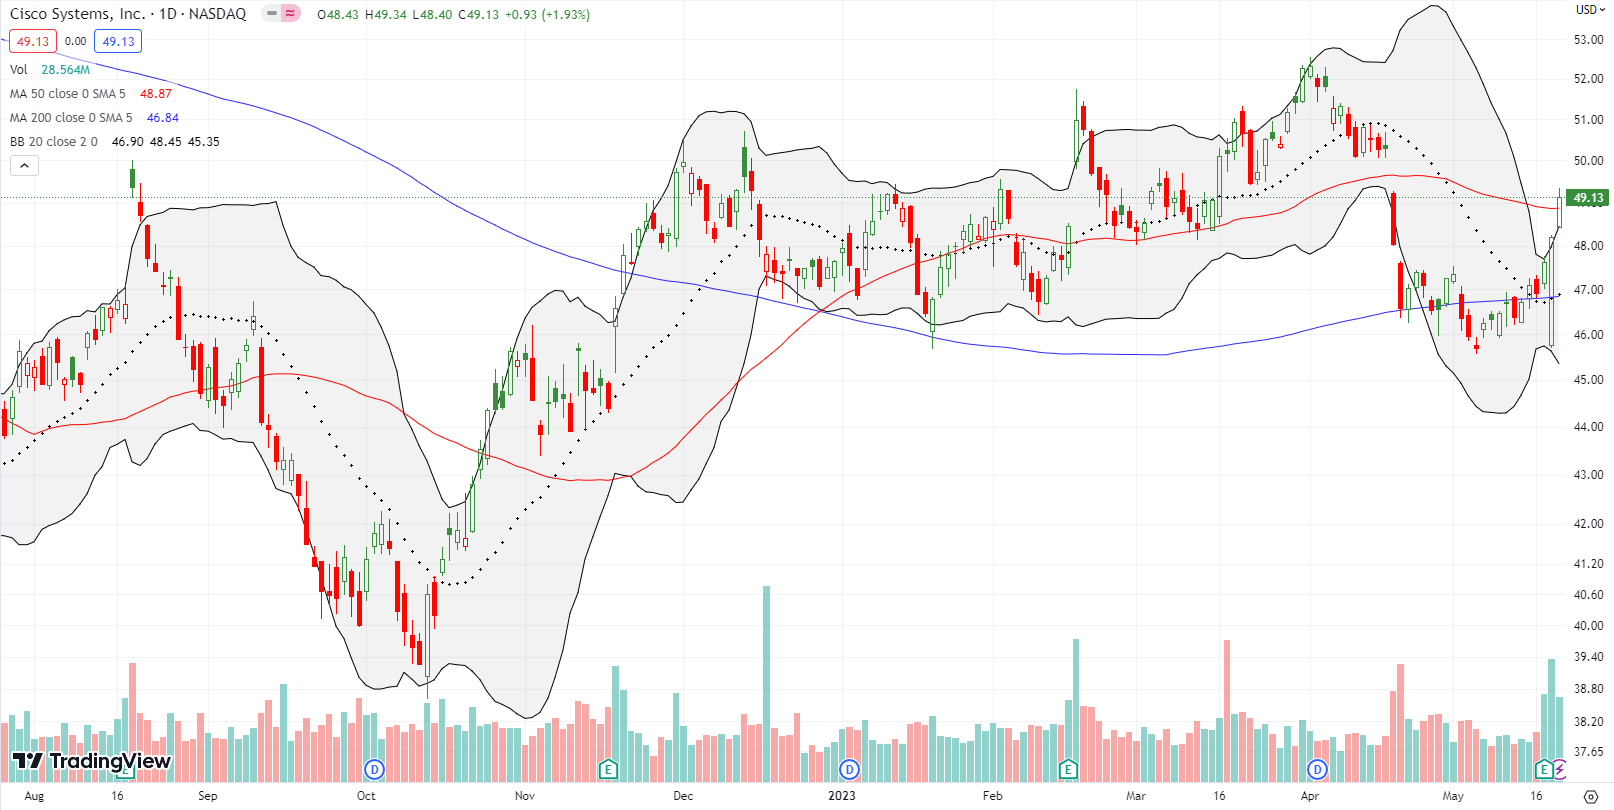
Sellers beware when an important stock quickly recovers from a post-earnings gap down and achieves a gain on the day. The seller’s warning transforms into an invitation for buyers after the recovery is confirmed with a subsequent close higher. These trading dynamics happened to Cisco Systems, Inc (CSCO) last week. I am a buyer on a close higher above the 50DMA (red line). I am hoping to buy into a dip though.
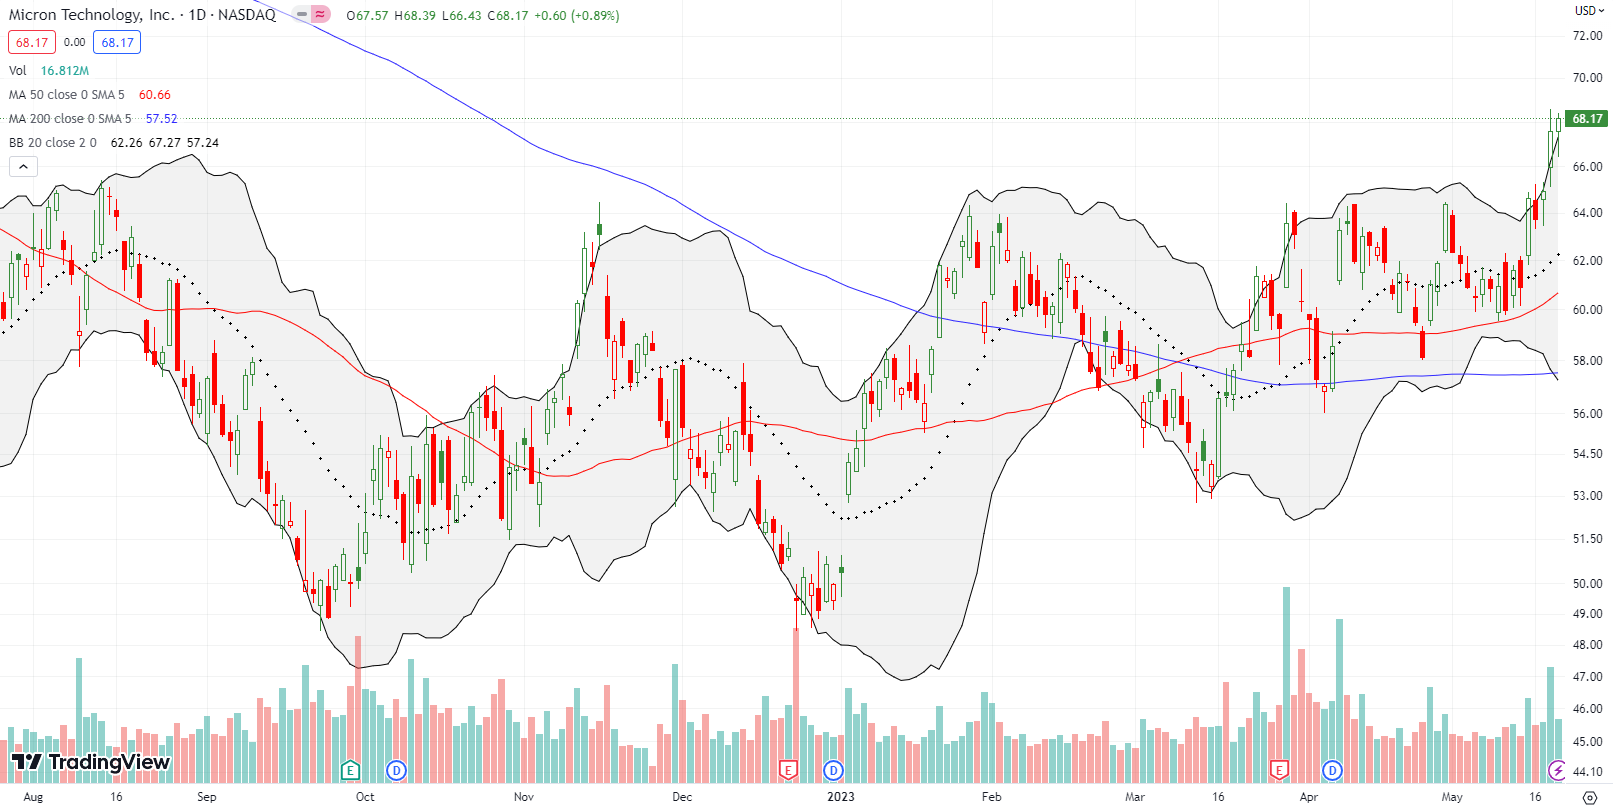
If semiconductors are cyclical, then the “down cycle” is officially history. Micron Technology, Inc (MU) has zig-zagged its way to an impressive breakout for an 11-month high. A good friend who is an MU fan will surely tell me the cyclical rules do not apply to MU’s secular tailwinds. Fine. Whatever the fundamental reasons to explain the move, MU is a buy here. Yet, more bad news from China over the weekend may create a fresh (temporary?) setback. See Reuters “China fails Micron’s products in security review, bars some purchases“.
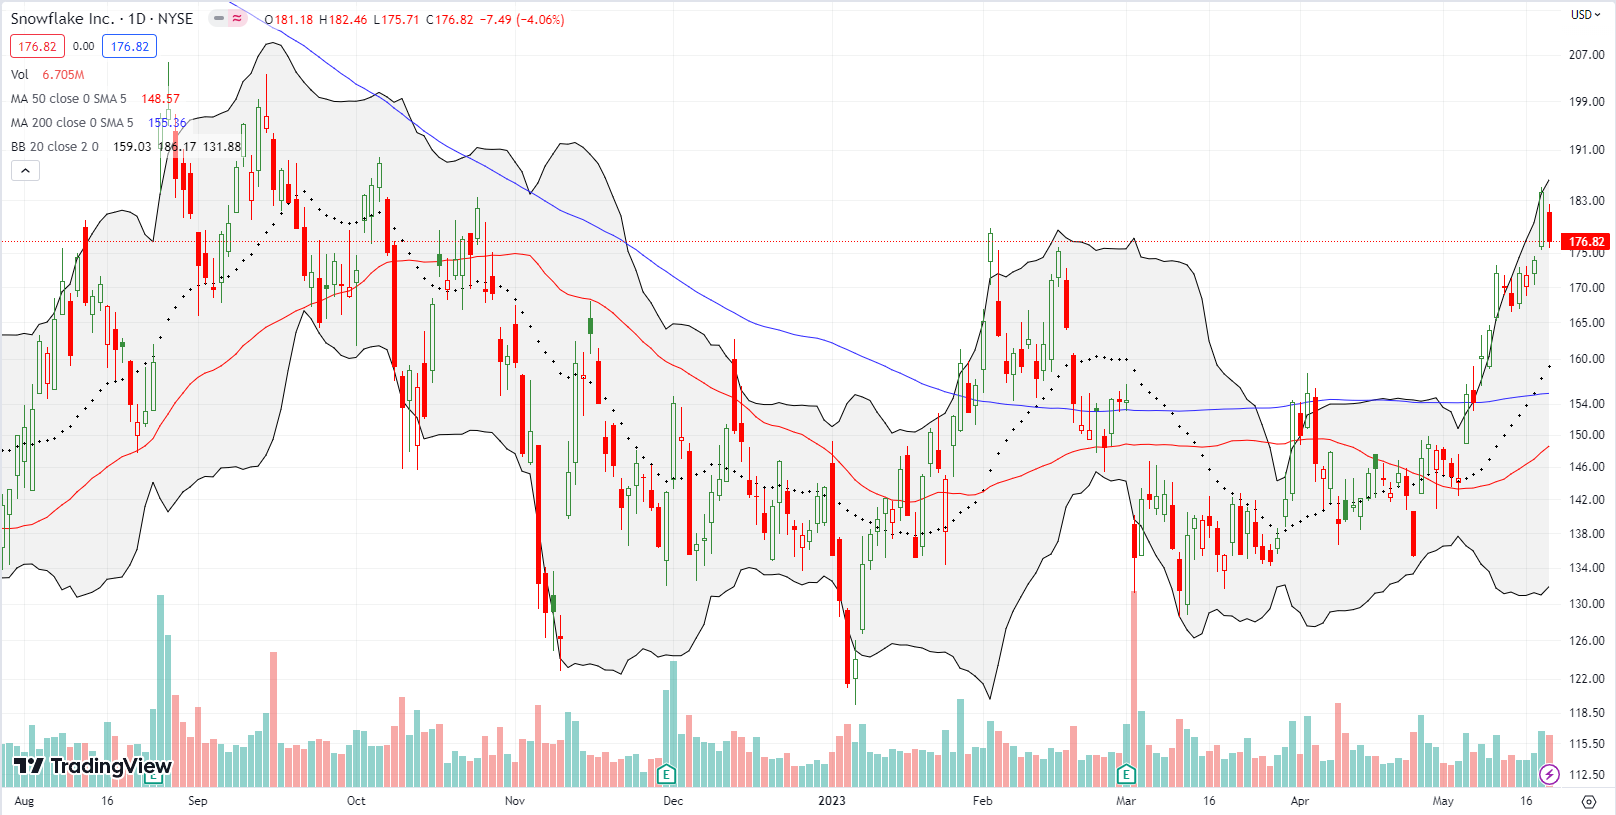
The earnings warning from CDW a month ago seemed to ring the death knell for IT-related stocks. However, I have seen exactly the opposite across many stocks. For example, cloud database company Snowflake Inc (SNOW) woke up from a post-earnings malaise and trading range on a confirmed 200DMA breakout. SNOW surged 5.9% on Thursday on rumors that the company is in “talks” to acquire Neeva. A market that awards spending money on acquisitions with an immediate hike in market value is a bullish market. Profit-takers rushed into SNOW on Friday and earnings are coming on May 24th, so buyer beware on this breakout!
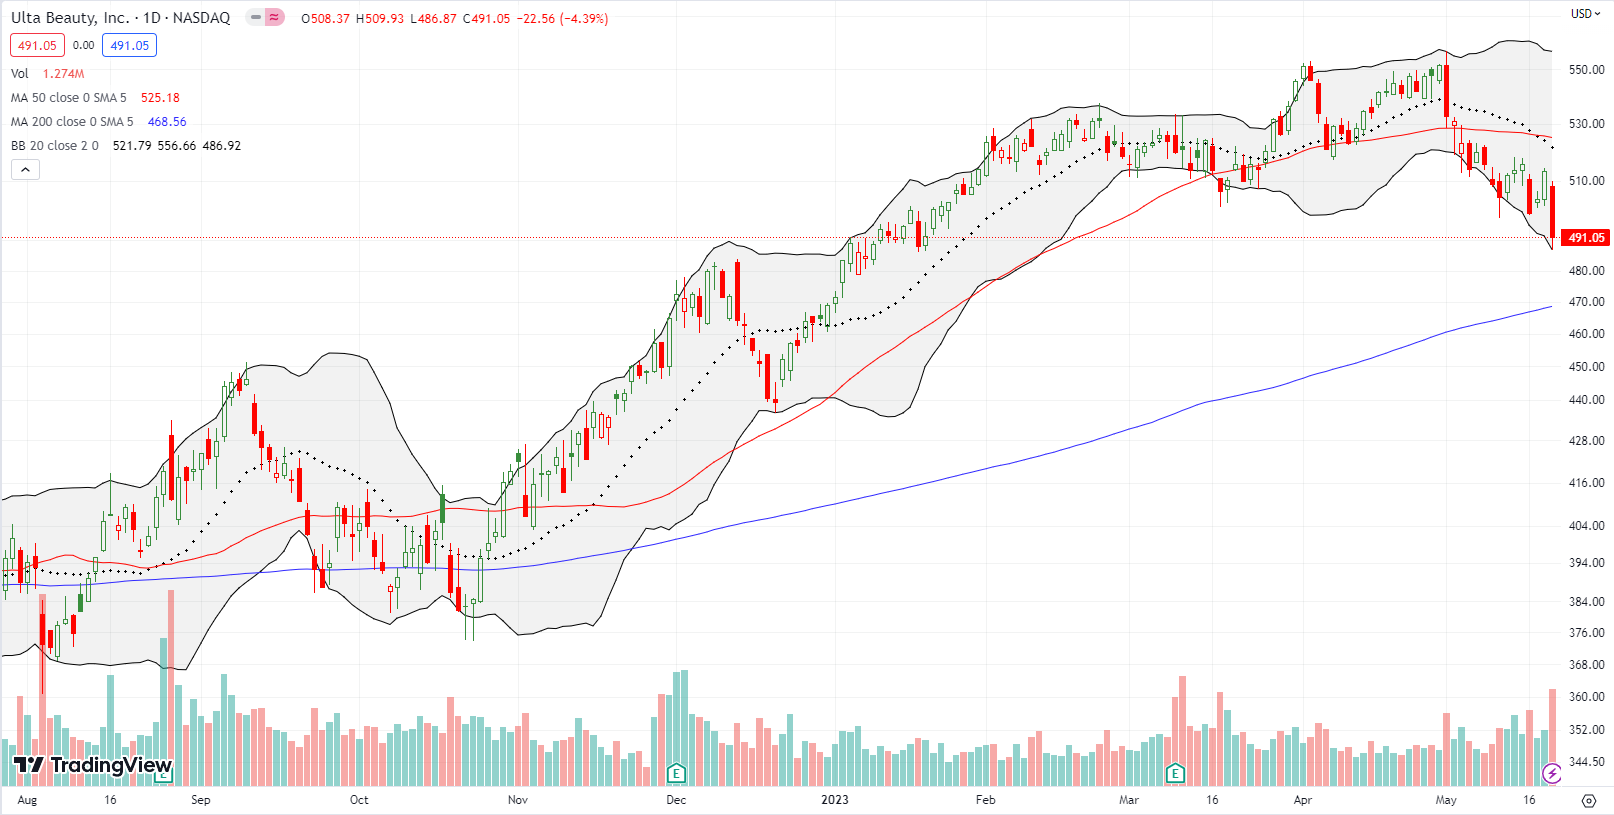
Ulta Beauty, Inc (ULTA) was looking like a refuge of “safety” after the stock rallied to an all-time high in the wake of the first regional banking disasters (beauty make-overs for teetering banks?). Support held at the 50DMA twice. However, the tides have suddenly turned with a confirmed 50DMA breakdown and downtrends unfolding on both the 20 and 50DMAs. ULTA has nearly reversed its entire 2023 breakout. This unfolding drama has me quite interested in upcoming earnings!
Be careful out there!
Footnotes
Subscribe for free to get email notifications of future posts!
“Above the 50” (AT50) uses the percentage of stocks trading above their respective 50-day moving averages (DMAs) to measure breadth in the stock market. Breadth defines the distribution of participation in a rally or sell-off. As a result, AT50 identifies extremes in market sentiment that are likely to reverse. Above the 50 is my alternative name for “MMFI” which is a symbol TradingView.com and other chart vendors use for this breadth indicator. Learn more about AT50 on my Market Breadth Resource Page. AT200, or MMTH, measures the percentage of stocks trading above their respective 200DMAs.
Active AT50 (MMFI) periods: Day #35 over 20%, Day #9 over 30%, Day #6 over 40%, Day #48 under 50%, Day 58 under 60%, Day #60 under 70%
Source for charts unless otherwise noted: TradingView.com
Full disclosure: long QQQ put spread, long VXX call spread
FOLLOW Dr. Duru’s commentary on financial markets via StockTwits, Twitter, and even Instagram!
*Charting notes: Stock prices are not adjusted for dividends. Candlestick charts use hollow bodies: open candles indicate a close higher than the open, filled candles indicate an open higher than the close.


