Stock Market Rebounds Stronger Than Before – Above the 40 (October 9, 2020)
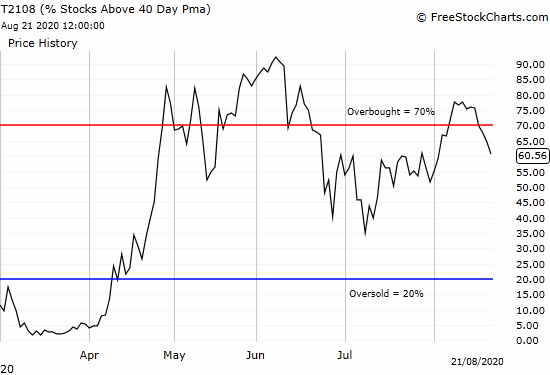
Stock Market Statistics AT40 = 61.1% of stocks are trading above their respective 40-day moving averages (DMAs) AT200 = 53.2% of stocks are trading above their respective 200DMAs VIX = 25.0 Short-term Trading Call: cautiously bullish Stock Market Commentary Without recognizing the bullish divergence that ended the previous week, last week’s trading dynamic of a … Read more