
Stock Market Statistics
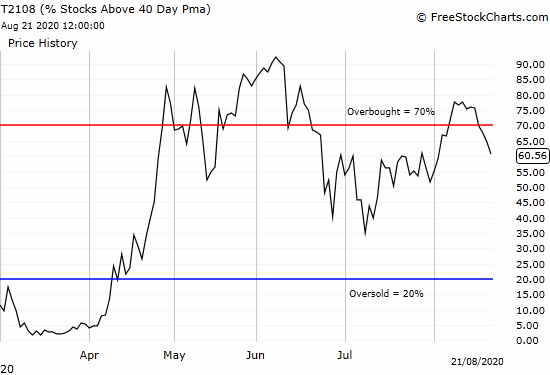
AT40 = 60.6% of stocks are trading above their respective 40-day moving averages (DMAs) (ended 7 overbought trading days)
AT200 = 42.7% of stocks are trading above their respective 200DMAs
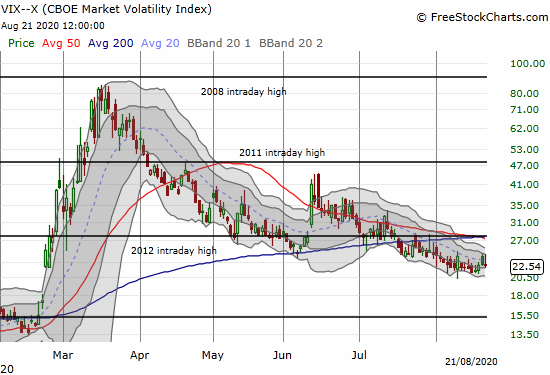
VIX = 22.5
Short-term Trading Call: cautiously bearish
Stock Market Commentary
AT40 (T2108), the percentage of stocks trading above their respective 40-day moving averages (DMAs), closed last Monday at 75.7%, comfortably sitting in overbought territory. On Tuesday, AT40 fell right under the overbought threshold of 70% with a close at 69.7%. My favorite technical indicator methodically declined for the rest of the week from 67.5% to 64.5% and finally to 60.6%.
This rapid decline in AT40 while the S&P 500 (SPY) and NASDAQ (COMPQX) managed to scratch and claw to new all-time highs creates the very essence of a bearish divergence. This is the most glaring signal I have seen since I last went bearish: first cautiously bearish in late January and then full out bearish in early February. This bearish divergence is much more convincing than the one which appeared briefly last month; at that time I left the trading call at neutral.
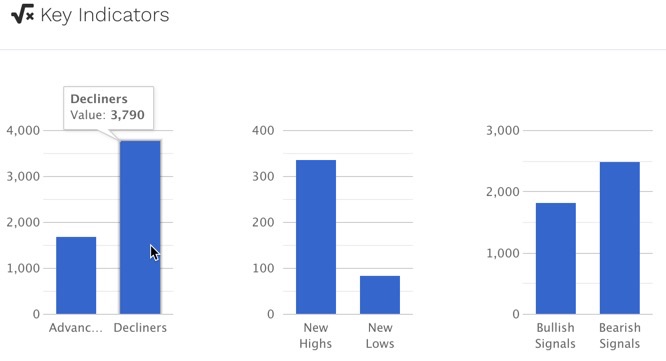
The advancers versus decliners numbers forced me to drop my yellow flag in exchange for a red flag. Decliners outpaced advancers by a 2:1 ratio on Friday despite the all-time highs in the major indices. According to swingtradebot, bearish stock signals outnumbered bullish signals by about a third. Yet, somehow, new highs towered over new lows. Taken together, these data further confirm a narrowing market rally: a few high-performing stocks are racing ahead of a stock market full of wilting and weakening stocks.
The Stock Market Indices
The slow-motion rally in the S&P 500 (SPY) came to a very brief end with Thursday’s small gap down. Buyers stepped in and never looked back. The index closed the week with a new all-time high.
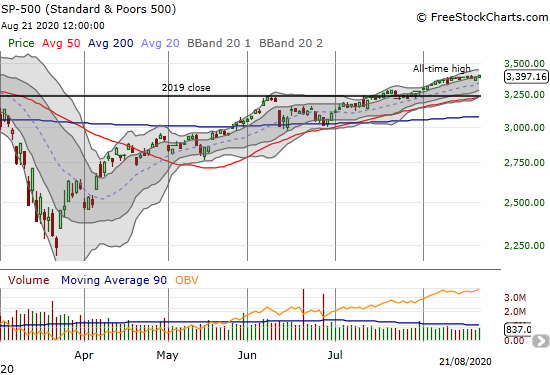
The NASDAQ (COMPQX) recovered from Thursday’s gap down open even more convincingly. Since the NASDAQ broke away from June’s tease with the 10K level, the tech-laden index is up about 10%. The relentless rally continues in tech.

Volatility
The volatility index (VIX) woke up a bit on Thursday only to get faded back to flatline. The sag continued on Friday after faders pushed back the VIX from intraday highs. These signs of life, albeit brief, forced my hand to build up my long volatility positioning a week ahead of schedule. As a reminder, I am expecting volatility to firm up and rally starting sometime in September and lasting through October.
The Short-Term Trading Call
The sharp slide in AT40 made me uncomfortable with the switch to cautiously bullish just two weeks ago.
I am almost as uncomfortable flipping to cautiously bearish, yet I am compelled to shred the prior bullish trading script. I am not ready to short anything aggressively, but I want to get my head ready to act when I see another strong confirming signal like a down day in the S&P 500 and/or NASDAQ greater than 1%. In the meantime, I will be warily “nursing” my remaining long trading positions. I will be quick to take profits and end losses at the first sign of additional trouble.
Note well that I am not anticipating a major sell-off. A “garden variety” 5-10% pullback seems even “healthy” from current levels. A 5% pullback in the S&P 500 creates a simple test of 50DMA support. A 10% pullback creates a relatively benign retest of support at the June lows. Given the rising 200DMA, I expect the S&P 500 to stop just short of such a test.
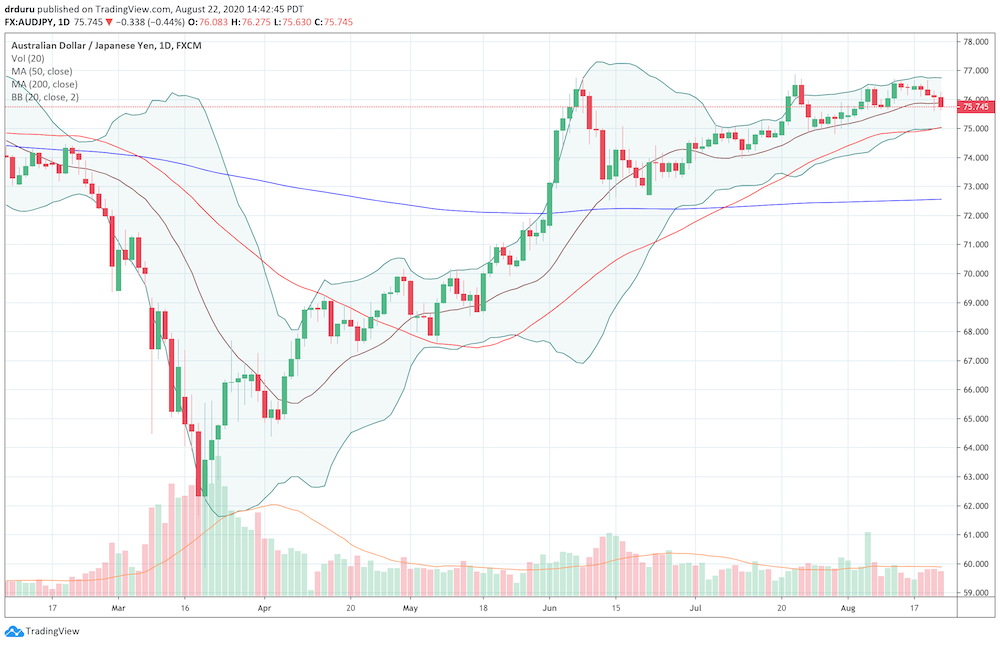
The currency markets are also flagging brewing trouble. The Australian dollar is weakening against the Japanese yen. AUD/JPY, my go-to currency for gauging risk attitudes, dropped below its 20DMA for the first time in two months. Like the stock market, the potential downside looks relatively shallow for now.
Bearish market calls must always come with caveats given the Federal Reserve stands ready to prop up the stock market. The most immediate wildcard is a fresh “stimulus” package from the Federal government. The stock market seems priced for the money to flow sooner than later. Getting that money should delay a pullback in the stock market. However, the money may only come after the stock market goes into convulsions.
My favorite trade in the wake of more government stimulus and intervention will be anti-dollar trades. The U.S. dollar index (DXY) looks like it is in the early days of a major debasement.
Stock Chart Reviews: Video Summary
Stock Chart Reviews – Below the 50DMA
Intel (INTC)
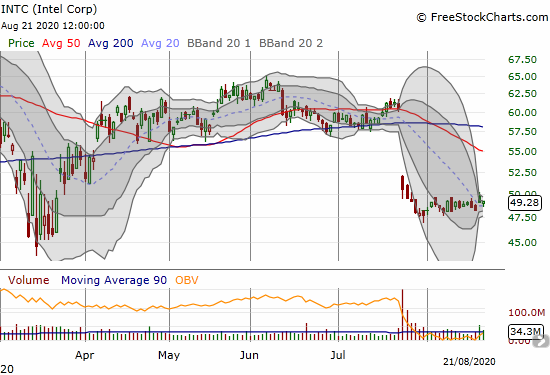
Intel (INTC) announced an acceleration of its existing stock repurchase program. INTC is trading just above its March lows, so this action makes a lot of sense. I was already buying calls as a part of my between earnings buying strategy on INTC. I am now inclined to buy shares for a longer-term hold if INTC dips further from here.
A Bollinger Band (BB) squeeze increases the stakes for the next move. The resolution from this squeeze, seen below as the extreme tightening of the grey bands that define the BBs, could be large and sustained.
Red Robin Gourmet (RRGB)
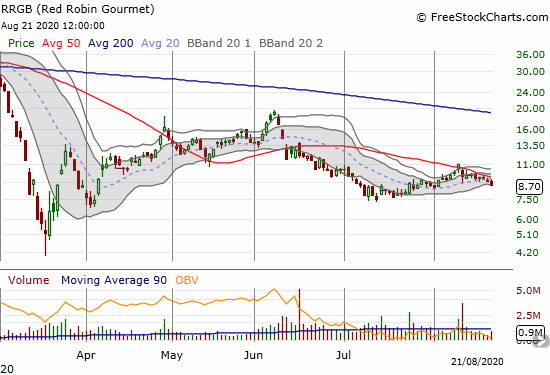
My trade selling puts into a volume surge worked out on Red Robin Gourmet (RRGB). The puts expired worthless. As the stock sags post-earnings, I am staying on the sidelines. I am suddenly not quite as bullish on RRGB’s prospects as casual dining is under increased threat with high levels of unemployment likely to linger for quite some time.
Stock Chart Reviews – Above the 50DMA
Netflix (NFLX)
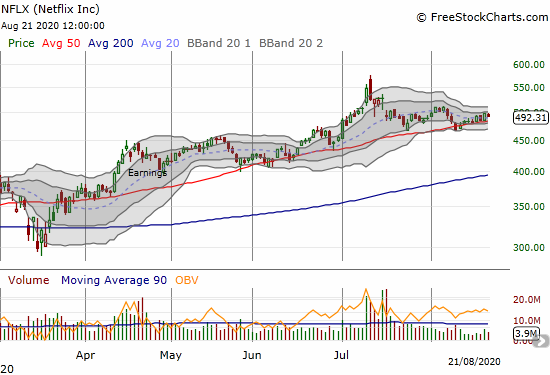
Netflix (NFLX) is biding its time along its 50DMA. The stock remains in post-earnings blues, but it has yet to break down into bearish territory.
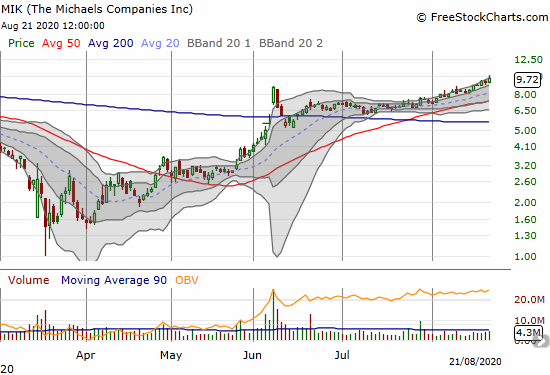
The Michaels Companies Inc (MIK)
The Michaels Companies Inc (MIK) is on a steady churn higher. The stock closed at a 10-month high. MIK first reversed its pandemic-related losses on the heels of a brief post-earnings surge in June. MIK looks like a good buy-the-dip play.
KB Home (KBH)
The pre-earnings trade in KB Home (KBH) worked out but the script took the trade right to the finish line. The long side of the July/August $36 calendar spread was up for expiration last week. A jump to $38.50 earlier in the week allowed me to take profits. Still, KBH is lagging a lot of home builders and is one of the remaining “catch-up” plays in the space.

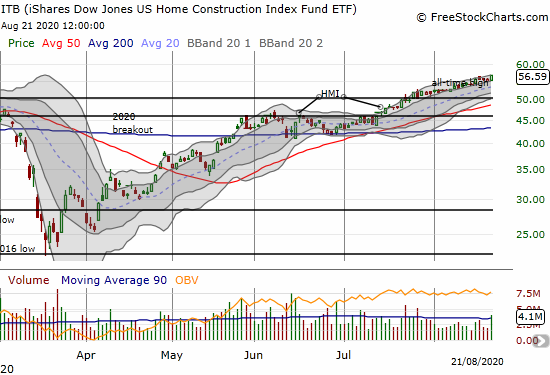
iShares Dow Jones US Home Construction Index Fund (ITB)
The iShares Dow Jones US Home Construction Index Fund (ITB) closed the week at an all-time high. The latest housing market news was as bullish as ever. This news and the parallel churn higher in housing-related stocks is bullish enough to make me wonder about the wisdom of flipping bearish on the stock market at this juncture.
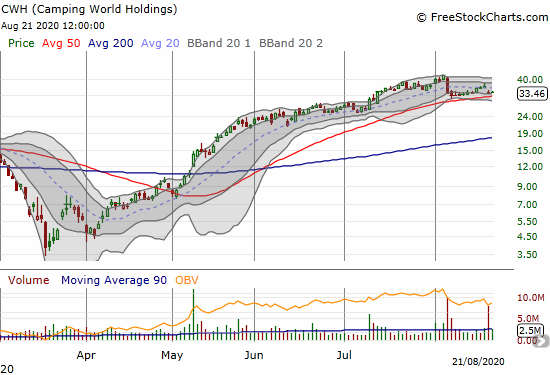
Camping World Holdings (CWH)
Camping World Holdings (CWH) lost a whopping 22.0% post-earnings earlier this month. I am impressed that the stock has yet to follow-through on that heavy selling, especially given the nosebleed run-up in the stock from March lows. While I am bullish on the outdoor recreation space, CWH suddenly looks shaky. Massive post-earnings losses off a lofty price usually signal a top. So I am on watch for a bearish 50DMA breakdown here.
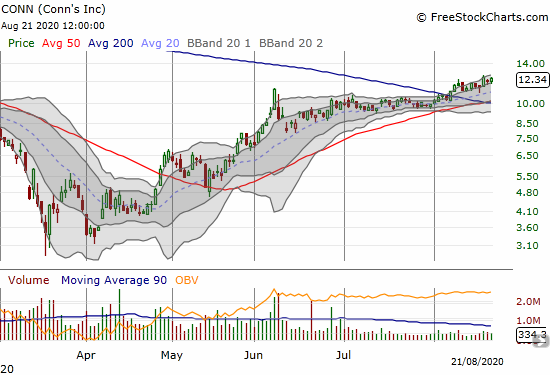
Conns (CONN)
Conns (CONN) delivered a 200DMA breakout earlier this month. If not for my bearish trading call, I would dare to speculate on the rally continuing for this electronics retailer.
Stock Chart Spotlight – Bullish Breakout
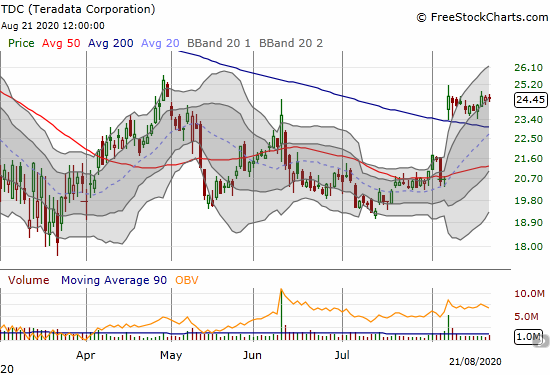
Teradata Corporation (TDC)
Teradata Corporation (TDC) was long ago a favorite “big data” play. TDC hit an all-time high around $80 in 2012. A subsequent sell-off finally ended 3 1/2 years later. The next rally peaked in early 2019 around $50. The current 200DMA breakout on the heels of earnings looks tradeable. I am a buyer here with a stop below $22.50. Stops are even more important in the context of a bearish trading call.
These 200DMA breakouts have been a bread and butter for several months. With a bearish trading call, there are almost no other (short-term) upside trades of interest to me.
— – —
FOLLOW Dr. Duru’s commentary on financial markets via email, StockTwits, Twitter, and even Instagram!
“Above the 40” uses the percentage of stocks trading above their respective 40-day moving averages (DMAs) to assess the technical health of the stock market and to identify extremes in market sentiment that are likely to reverse. Abbreviated as AT40, Above the 40 is an alternative label for “T2108” which was created by Worden. Learn more about T2108 on my T2108 Resource Page. AT200, or T2107, measures the percentage of stocks trading above their respective 200DMAs.
Active AT40 (T2108) periods: Day #92 over 20%, Day #86 over 30%, Day #31 over 40%, Day #27 over 50%, Day #13 over 60% (overperiod), Day #4 under 70% (underperiod)
Daily AT40 (T2108)
")
Black line: AT40 (T2108) (% measured on the right)
Red line: Overbought threshold (70%); Blue line: Oversold threshold (20%)
Weekly AT40 (T2108)

*All charts created using FreeStockCharts unless otherwise stated
The T2108 charts above are my LATEST updates independent of the date of this given AT40 post. For my latest AT40 post click here.
Be careful out there!
Full disclosure: long UVXY shares and puts, long INTC calls, short AUD/JPY
*Charting notes: FreeStockCharts stock prices are not adjusted for dividends. TradingView.com charts for currencies use Tokyo time as the start of the forex trading day. FreeStockCharts currency charts are based on Eastern U.S. time to define the trading day.
I sure do appreciate your views and data based evaluations.
Thanks again, Sam!