
Stock Market Statistics
- AT40 = 61.1% of stocks are trading above their respective 40-day moving averages (DMAs)
- AT200 = 53.2% of stocks are trading above their respective 200DMAs
- VIX = 25.0
- Short-term Trading Call: cautiously bullish
Stock Market Commentary
Without recognizing the bullish divergence that ended the previous week, last week’s trading dynamic of a stock market rebound would appear bizarre. The stock market rebounded out of and through a lot of drama and risk.
On Monday, the stock market came back stronger than even President Trump’s COVID-19 recovery. The next day pushed the S&P 500 back underneath its 50-day moving average (DMA) thanks to an abrupt demand from Trump to end COVID-19 relief negotiations until after the November election. Trump flip-flopped overnight, and the stock market followed up with an important bullish milestone. Although Senate Republicans rebuffed the President’s effort to instantly revive relief negotiations, the stock market maintained its rebound. After all the dust settled, the S&P 500 (SPY) ended the week with an impressive 3.8% gain.
The stock market made an important statement: it is now determined to ignore as much risk as possible….even determined to feed off the risk.
The Stock Market Indices
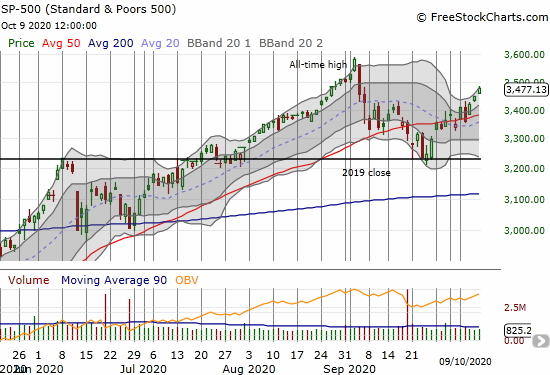
The S&P 500 (SPY) cleared hurdles and travelled through its upper Bollinger Band (BB). A full recovery from the September pullback is underway with this stock market rebound.
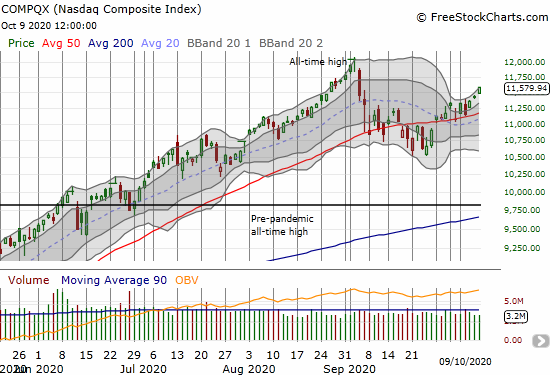
The NASDAQ (COMPQX) still has a similar profile to the S&P 500 and is a full participant in the stock market rebound. The tech-laden index out-performed on Friday with a 1.4% gain
The iShares Russell 2000 Index Fund ETF (IWM) slowed down a bit with a 0.5% gain (graph not shown). Still, the index of small-cap stocks hit a major milestone by finally pushing into the big gap down from February 24th. That day kicked off the stock market’s collapse in March with synchronized 50DMA breakdowns.
Stock Market Volatility
The volatility index (VIX) dropped three days in a row to end the week. The VIX last closed lower on August 28th. Suddenly, the odds seem to favor the VIX retesting its lows in August before the next big pop as a continued stock market rebound will drive the VIX ever lower.

The Short-Term Trading Call for the Stock Market Rebound
The stock market is in a bullish mode right in the middle of one of its most dangerous months. October ties August for the largest average drawdown for the S&P 500. October is second only to August for largest median drawdown. The relationship makes me wonder whether strong August performances increase the odds of a strong October (and a weak September); something to study in a future post.
The short-term trading call stays at cautiously bullish. However, I am now warily eyeing AT40 (T2108), the percentage of stocks trading above their respective 40DMAs. My favorite technical indicator is above 60%. At the current rate, the stock market could easily flip to overbought trading conditions (AT40 above 70%) this week. If this flip happens, I will change the trading call to neutral in deference to the historical risks of October and the near certain risks coming with November’s Presidential election in the U.S….even if the stock market insists on powering right through the risks.
Stock Chart Reviews – Video Summary
Stock Chart Reviews – Below the 50DMA
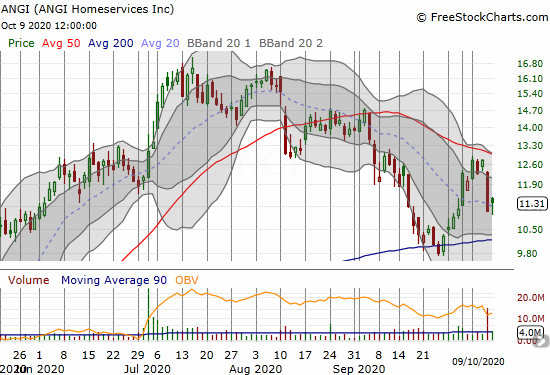
ANGI Homeservices Inc. (ANGI)
ANGI Homeservices Inc. (ANGI) downshifted after reporting earnings on August 10th. The day after, ANGI plunged 16.3% and broke through 50DMA support. The 50DMA has held as resistance ever since. I am watching closely for a 50DMA breakout (buy) or a 200DMA breakdown (short/sell). This company specializes in locating home service professionals. This industry should be ever more critical in the new digital economy, so I prefer to chase a 50DMA breakout.
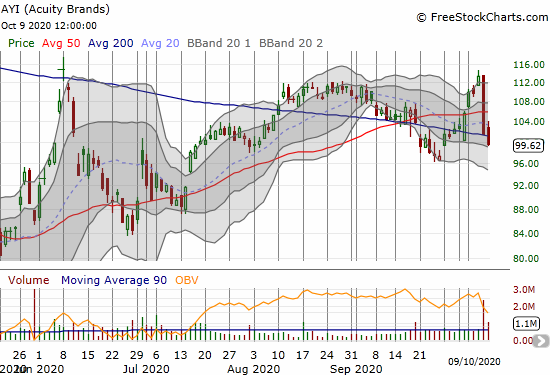
Acuity Brands (AYI)
Acuity Brands (AYI) provides lighting solutions for commercial real estate. Given the number of companies with employees working from home, I expect Acuity’s business to lag. The stock did well to challenge the June highs ahead of earnings. However, earnings disappointed, and AYI kicked off earnings season with a telling 10.4% loss. On Friday, sellers picked up where they left off and sent AYI bearishly through its 200DMA.
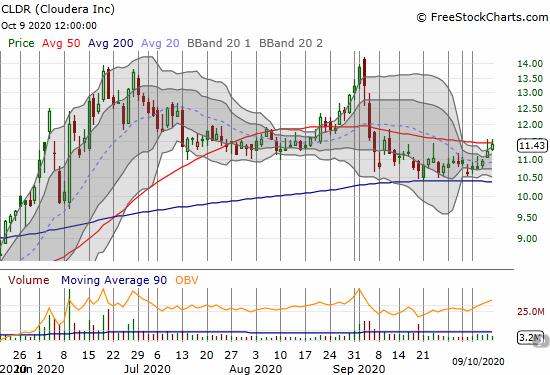
Cloudera (CLDR)
Through July and August Cloudera (CLDR) looked like it was completing a bullish cup and handle pattern. Earnings brought that trading pattern to an abrupt end. The 200DMA held as support in September. That support looks like it is transforming into a launchpad for a bullish 50DMA breakout.
iShares Barclays 20+ Year Treasury Bond Fund (TLT)
I accumulated December call options in iShares Barclays 20+ Year Treasury Bond Fund (TLT) as a partial hedge against election-related drama and troubles. Last week, TLT tested its 200DMA several times. TLT last traded below its 200DMA almost TWO years ago. As a result, I will treat a 200DMA breakdown like a major signal of higher rates to come. Financial markets could be preparing for an ever-expanding Federal budget deficit and accompanying inflation risks.

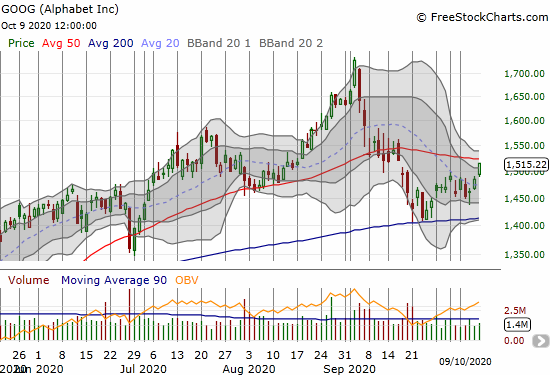
Alphabet (GOOG)
Alphabet (GOOG) fought back against negative anti-trust headlines to make a break for 50DMA resistance. I am a buyer (again) on a 50DMA breakout. GOOG is a relative laggard these days among high-tech stocks.
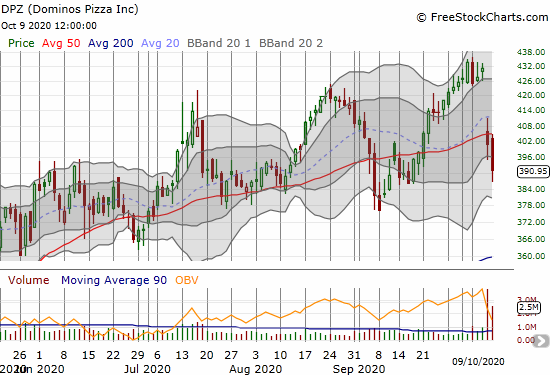
Dominos Pizza (DPZ)
Dominos Pizza (DPZ) suffered a rare post-earnings setback last week. I am watching for an eventual recovery above the 50DMA. DPZ enjoyed a major run to-date. A 25.6% post-earnings pop provided the stock a major cushion just ahead of the pandemic in the U.S. After filling the gap, DPZ stabilized and then never looked back. DPZ closed at new all-time highs ahead of earnings.
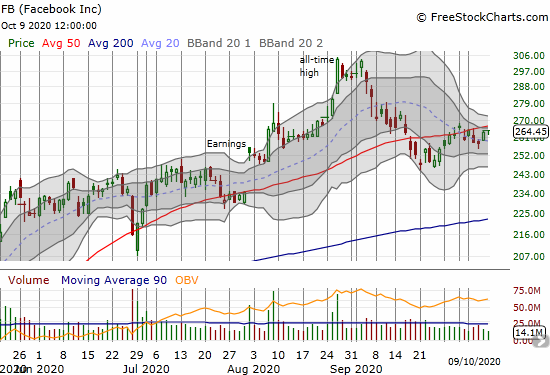
Facebook (FB)
Facebook (FB) is slowly recovering from the September sell-off. FB is lazily following its 50DMA upward. I like buying back into FB above $270 on the assumption that the stock will remain nearly impervious to headline risks.
Stock Chart Reviews – Above the 50DMA
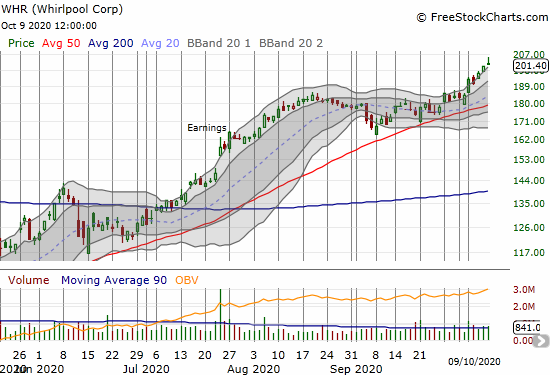
Whirlpool Corp (WHR)
Whirlpool (WHR) broke out this month as part of a near relentless rebound from early September lows. Steady gains last week put WHR within striking distance of the all-time high set in 2015.
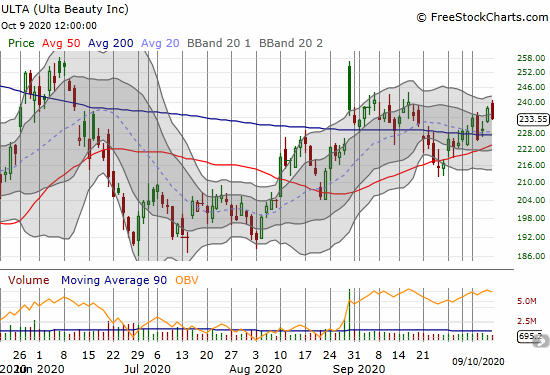
Ulta Beauty (ULTA)
Ulta Beauty (ULTA) is still trying to break free of its 200DMA. Even with the gap and crap in August, I thought ULTA would eventually regain 200DMA breakout momentum. Instead, the stock retested 50DMA support in late September. The latest 200DMA breakout is buyable here.
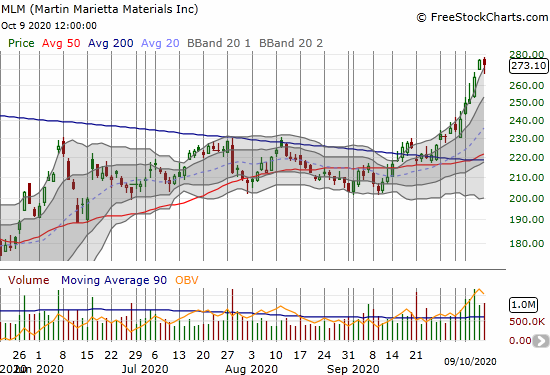
Martin Marietta Materials (MLM)
Martin Marietta Materials (MLM) was a solid 200DMA breakout play in late September. This month, MLM took the elevator. On Friday, MLM finally recovered its pandemic-related losses. MLM is a major infrastructure and materials play.
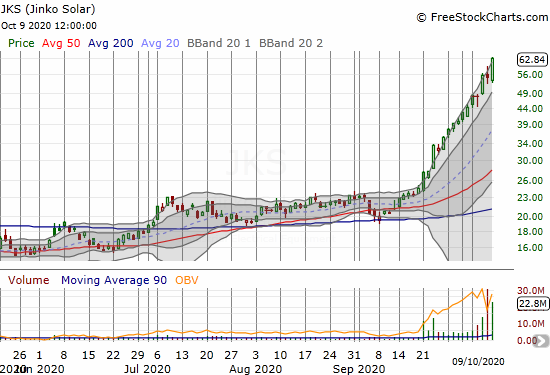
Jinko Solar (JKS)
Alternative energy is all the rage with solar experiencing a kind of renaissance. I am now reading more and more explanations that tie the surge in alternative energy stocks to bets on a Democratic sweep in November. Presumably, such an event will usher in a lot of green energy spending. (Perhaps Tesla was the canary shining the light earlier this year??!).
While I chased First Solar’s multi-month breakout, other solar plays received preferential treatment. Jinko Solar (JKS) is on an artistic moonshot higher with a near non-stop rally since late September.
First Solar (FSLR)
First Solar (FSLR) is lagging the solar renaissance thanks to a stock offering that took the stock through a 50DMA breakdown last month. FSLR is now playing catch-up.

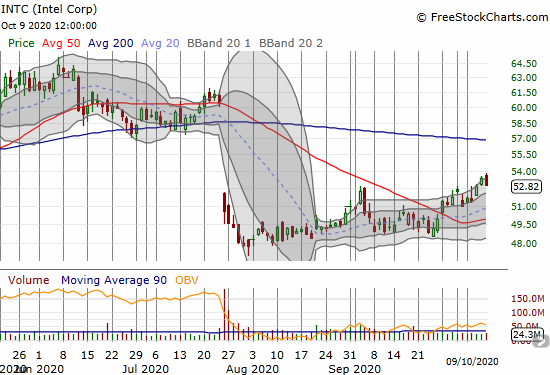
Intel Corp (INTC)
Intel Corp (INTC) is slowly but surely repairing the damage from July’s post-earnings carnage. I locked in profits on my latest “between earnings” call option trade on INTC. The latest September 50DMA breakout looks bullish. Still, per my enduring trading strategy on INTC, I am waiting for INTC’s next earnings report before making a fresh trade.
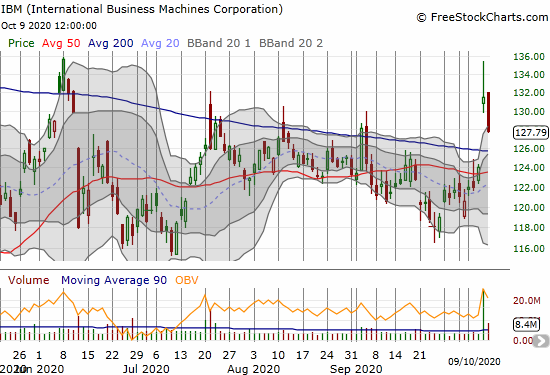
International Business Machines (IBM)
The on-going struggles for International Business Machines (IBM) now include a series of false 200DMA breakouts since June. IBM’s latest attempt to wake from its multi-year stupor is a split of the company which represents yet one more attempt to create value by divestiture. The excitement lasted all of 15 minutes at the open on Thursday. Faders have not stopped selling since then.
Bullish 200DMA Breakout
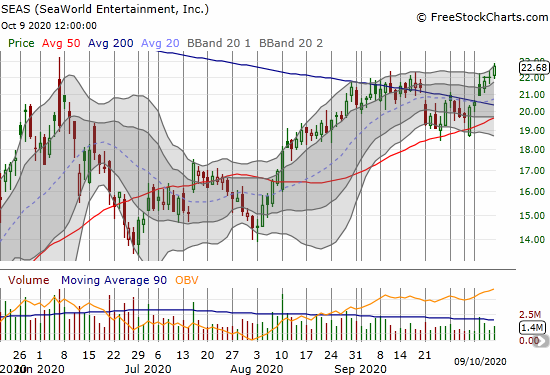
SeaWorld Entertainment, Inc. (SEAS)
SeaWorld Entertainment (SEAS) attempted its first 200DMA breakout last month. The 50DMA stood in as support for the current second attempt. With a higher high, SEAS is an even stronger 200DMA breakout play.
— – —
FOLLOW Dr. Duru’s commentary on financial markets via email, StockTwits, Twitter, and even Instagram!
“Above the 40” uses the percentage of stocks trading above their respective 40-day moving averages (DMAs) to assess the technical health of the stock market and to identify extremes in market sentiment that are likely to reverse. Abbreviated as AT40, Above the 40 is an alternative label for “T2108” which was created by Worden. Learn more about T2108 on my T2108 Resource Page. AT200, or T2107, measures the percentage of stocks trading above their respective 200DMAs.
Active AT40 (T2108) periods: Day #10 over 20%, Day #9 over 30%, Day #6 over 40%, Day #3 over 50%, Day #1 over 60% (overperiod ending 24 days under 60%), Day #28 under 70%
Daily AT40 (T2108)
")
Black line: AT40 (T2108) (% measured on the right)
Red line: Overbought threshold (70%); Blue line: Oversold threshold (20%)
Weekly AT40 (T2108)

*All charts created using FreeStockCharts unless otherwise stated
The T2108 charts above are my LATEST updates independent of the date of this given AT40 post. For my latest AT40 post click here.
Be careful out there!
Full disclosure: long QQQ puts, long UVXY, long MLM, long CLDR, long FSLR and short covered call, long TLT calls
*Charting notes: FreeStockCharts stock prices are not adjusted for dividends. TradingView.com charts for currencies use Tokyo time as the start of the forex trading day. FreeStockCharts currency charts are based on Eastern U.S. time to define the trading day.