Stock Market Statistics
AT40 = 53.8% of stocks are trading above their respective 40-day moving averages (DMAs)
AT200 = 33.5% of stocks are trading above their respective 200DMAs
VIX = 25.8
Short-term Trading Call: neutral
Stock Market Commentary
AT40 (T2108), the percentage of stocks trading above their respective 40-day moving averages (DMAs), barely budged all week even as the stock market experienced sharp moves, especially with big-cap tech initiating a big unwind. The setups I described in the last Above the 40 post quickly materialized on Monday, and I rushed to chase some of the follow-through. Given I was late, I chose calendar call spreads on weeklies expiring over the next two weeks. This choice turned out to be fortuitous given the tech pullbacks that dominated the rest of the week.
The stock market is now bracing for earnings from 4 of the 5 top 1 percent of S&P 500 stocks as well as news from Congress on the next round of assistance for Americans still suffering from the fallout from the coronavirus pandemic. The Federal Reserve will also announce its next pronouncements on monetary policy; no doubt the Fed stands ready to lean against any persisting unwind in stocks. The Fed in particular may need to stand up as a loud cheerleader for more stimulus if Congress continues to waffle.
The Stock Market Indices
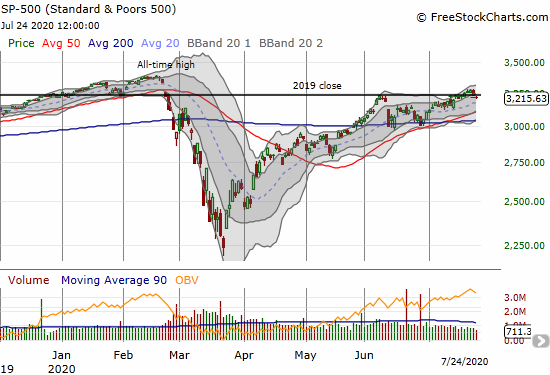
The S&P 500 (SPY) started the week with a 0.8% gain and a breakout to a small year-to-date gain. The cheer lasted two more days before two days of selling unwound the small breakout. Strong selling in the top 1 percent of the index led the way downward.
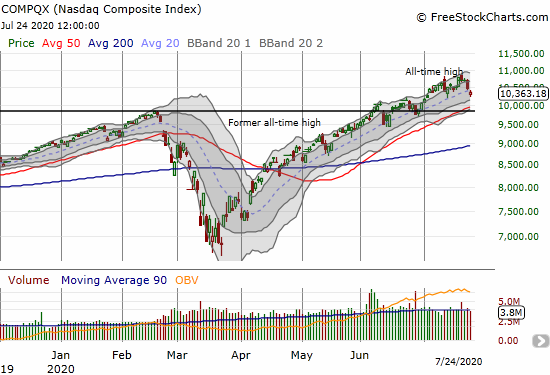
The NASDAQ (COMPQX) entered the week in a “prove it” mode given a bearish engulfing topping pattern on July 13th. The tech-laden index’s 2.5% surge on Monday to a fresh all-time closing high seemed to provide the proof that tech was still in business-as-usual mode. Yet, the NASDAQ did not quite invalidate the bearish engulfing pattern and sellers once again descended upon tech. The NASDAQ ended the week with a close below its 20DMA for just the second time since April 3rd. The week turned into an unwind that is precariously perched on the edge of getting worse.
A lower close for the NASDAQ puts the uptrending 50DMA support in play and makes quick bearish bets on tech more attractive. A rebound from current levels puts the previous uptrend in price back in play. I accumulated QQQ calls expiring next week assuming that big-cap tech would pull off its typical resurgence. These calls now provide a potential platform with hedged pre-earnings plays on big-cap tech.
Volatility
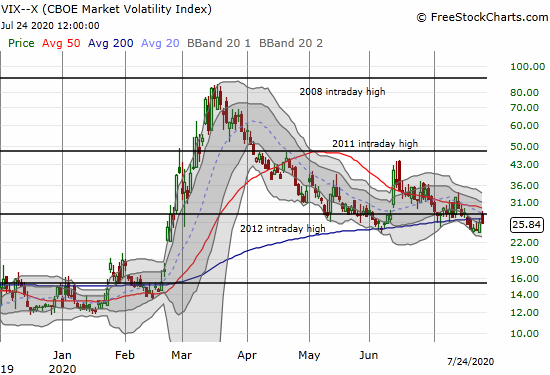
The volatility index (VIX) showed some fresh life with a 7.2% gain on Thursday and a gap up to start trading on Friday. The volatility faders went to work from there and closed out the VIX with a small loss on the day. I remain long volatility because too many things could go wrong in the coming weeks between big cap tech earnings and machinations in Congress over the next round of financial assistance to Americans still suffering the fallout from the coronavirus pandemic. I want the hedge given the current unwind in key stocks.
The Short-Term Trading Call
The short-term trading call is still at neutral with AT40 trading in a tight range and the stock market’s bearish divergence resolving into a very focused unwind of the market’s leaders. AT40 hit 60% on Wednesday and closed the week just under that. A good group of stocks are hanging in there and perhaps benefited from some rotation of money out of the top 1 percent. Overall, the stock market is priced as though everything will go well in the coming weeks. That setup makes me want to favor bearish bets even as I continue to seek out select bullish opportunities. My neutral stance means I only chase bearish bets on key technical breakdowns.
Stock Chart Reviews: A Video Summary
Stock Chart Reviews – Below the 50DMA
PetMed Express (PETS)
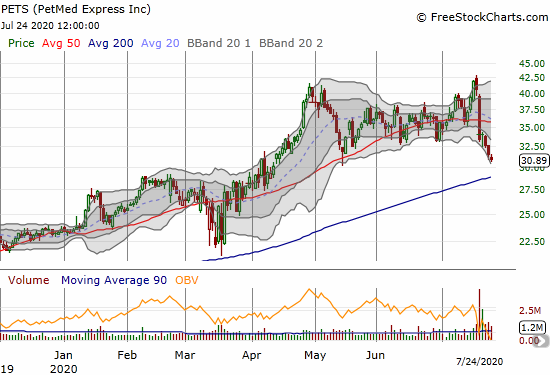
PetMed Express (PETS) confirmed a double-top with a 17.7% post-earnings loss. Support at the 200DMA is now in play. I am hard-pressed to understand the depths of the selling given the company reported strong year-over-year results across a broad swath of metrics (see the Seeking Alpha transcript of the conference call). PETS even reported its highest ever percentage increase in new order sales. CEO Mendo Akdag provided the following explanation:
“Demand has been strong for ecommerce and that coincided with our peak season. So, that helped new orders. Also, we advertised — our advertising was more effective. Advertising pricing was more favorable in the quarter and demand was strong, as I said.”
Perhaps investors were disappointed that PETS failed to provide go-forward guidance? Simple profit-taking snowballed out of control? Only three analysts asked questions during the conference call. I will be watching closely to see whether PETS can confirm 200DMA support.
Intel (INTC)
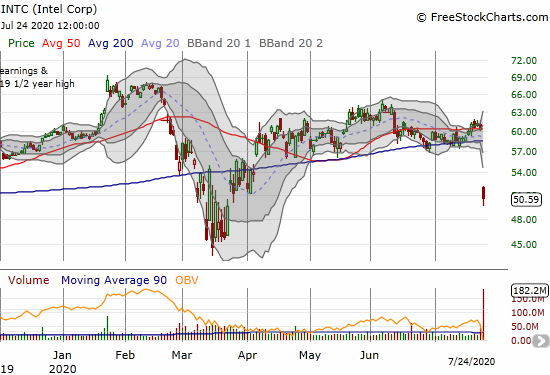
Intel (INTC) produced a huge earnings miss with a 6-month delay in its 7-nanometer CPU. INTC lost a swift 16.2%. Thank goodness I only trade INTC between earnings. I am looking to take the next swing on call options with a fill of the March gap up from $49.58.
Stock Chart Reviews – Above the 50DMA
Advanced Micro Devices (AMD)
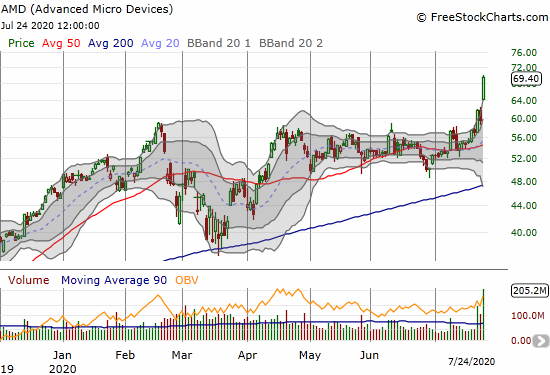
Intel’s big loss was AMD’s big win. Advanced Micro Devices (AMD) went parabolic to end the week at an all-time high. AMD gained 16.5% on the day. AMD is a buy on the dips. Earnings are on July 28th, and I will be very interested to see whether the stock can hold these parabolic gains post-earnings. I took profits on my position out of an abundance of caution.
Best Buy (BBY)
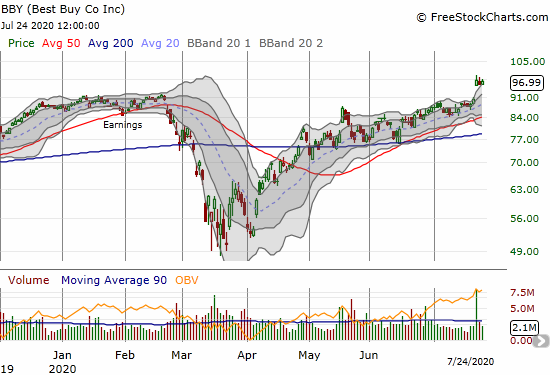
While Best Buy (BBY) is one of the winners with the work-from-home (WFH) crowd, I am still surprised to see the stock trading at all-time highs. The electronics retailer reported strong earnings results. BBY is a buy on the dips.
BHP Group (BHP)
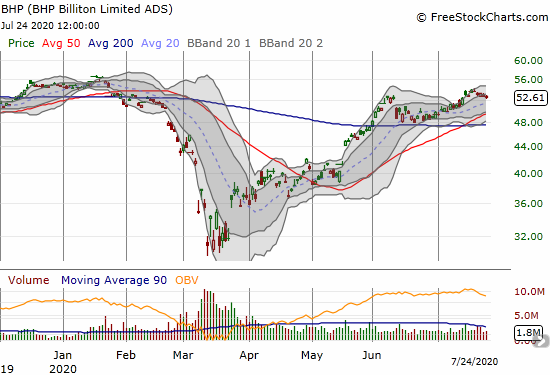
The U.S. dollar (DXY) was smashed this week, so I was surprised to see a commodity player like BHP Group (BHP) slowly drifting lower all week. I loaded up on a fresh fistful of call options expiring on September to give some runway for a run-up into and/or after earnings next month.
Rio Tinto (RIO)
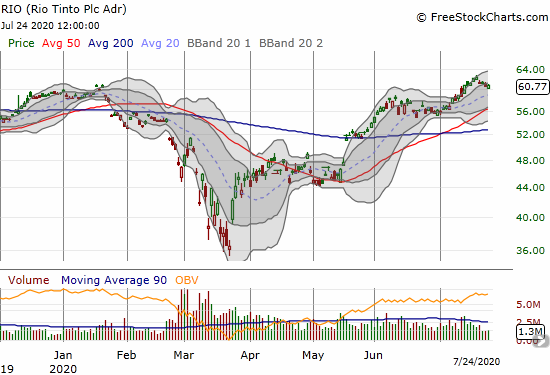
Normally I would do a pairs trade between BHP and Rio Tinto (RIO) but not with both stocks in good fundamental positions. The environment is perfect for commodities with China ramping up production and the U.S. dollar selling off. Just like BHP, I started a fresh round of accumulating September call options. I am a buyer all the way to 50DMA support.
CyberArk Software (CYBR)
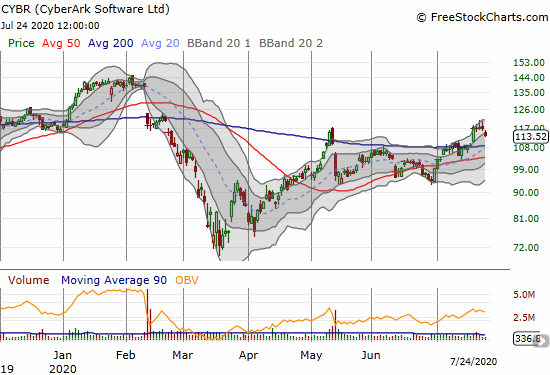
CyberArk Software (CYBR) started the week with a bullish 200DMA breakout on the heels of a 7.8% gain. The stock failed to make further gains and even lost 2.9% on Friday. I bought the stock’s breakout. As a reminder, the 200DMA breakout trade has become my favorite trade of late.
Moderna (MRNA)
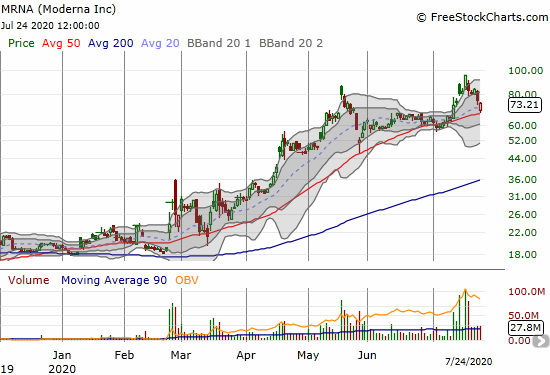
Pharmaceutical company Moderna (MRNA) is at the center of the race to find a vaccine for COVID-19. The stock has experienced several vaccine-related surges. The company has also met controversy with massive insider sales.
Note Moderna does not generate revenue and has no product beyond the vaccine trials. However, MRNA’s uptrend along 50DMA support speaks for itself. The stock’s picture-perfect bounce off support makes it a buy. I prefer options since this kind of stock can open one fine morning with a 10% or worse gap down.
Snap Inc. (SNAP)
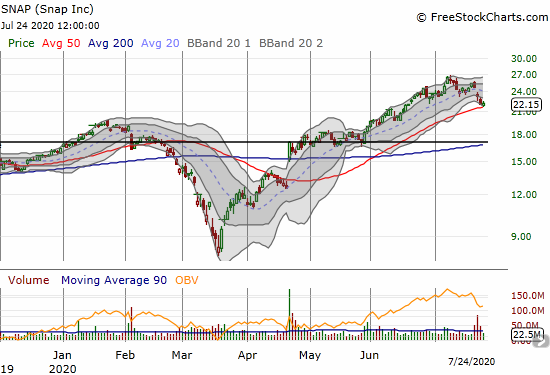
Social media company Snap (SNAP) finally ran into fresh selling thanks to disappointing earnings. I am eyeing the stock for a trade as it tests 50DMA support. I am more interested in chasing a breakdown with put options than chasing a 50DMA bounce.
Stock Chart Spotlight – Bullish Breakout
Xylem (XYL)
Xylem (XYL) is not a strong 200DMA breakout candidate given the complete lack of follow-through for 6 straight days. Still, the base formed since March looks pretty good. I am poised to buy the stock as soon as it confirms the 200DMA breakout with a higher close. The big caveat is earnings on July 30th. Xylem is an international company that engineers and manufactures water and wastewater products.
— – —
FOLLOW Dr. Duru’s commentary on financial markets via email, StockTwits, Twitter, and even Instagram!
“Above the 40” uses the percentage of stocks trading above their respective 40-day moving averages (DMAs) to assess the technical health of the stock market and to identify extremes in market sentiment that are likely to reverse. Abbreviated as AT40, Above the 40 is an alternative label for “T2108” which was created by Worden. Learn more about T2108 on my T2108 Resource Page. AT200, or T2107, measures the percentage of stocks trading above their respective 200DMAs.
Active AT40 (T2108) periods: Day #72 over 20%, Day #66 over 30%, Day #11 over 40%, Day #7 over 50% (overperiod), Day #2 under 60% (underperiod), Day #25 under 70%
Daily AT40 (T2108)

Black line: AT40 (T2108) (% measured on the right)
Red line: Overbought threshold (70%); Blue line: Oversold threshold (20%)
Weekly AT40 (T2108)

*All charts created using FreeStockCharts unless otherwise stated
The T2108 charts above are my LATEST updates independent of the date of this given AT40 post. For my latest AT40 post click here.
Be careful out there!
Full disclosure: long UVXY, long BHP calls, long RIO calls, long QQQ calls, long CYBR
*Charting notes: FreeStockCharts stock prices are not adjusted for dividends. TradingView.com charts for currencies use Tokyo time as the start of the forex trading day. FreeStockCharts currency charts are based on Eastern U.S. time to define the trading day.

