A BE READY Kind of Day in the Stock Market – The Market Breadth

A Be Ready Kind of Day in the Stock Market

Stock Market Commentary Right after the stock market tempted me to flip from bearish to neutral, January’s CPI (consumer price index) turned brought the bears rushing back to the scene. Inflation’s fizzle turned to sizzle, and the technical picture of the stock market almost flipped on its head. The charts say it all – the … Read more

The Summer of Loving Stocks Loses July’s Gains – The Market Breadth

loses Julys gains (Credit: Lost puppy at window by Martin Cooper on Flickr)

Stock Market Commentary The summer of stocks looks like it is winding down as trading dynamics transition into the stock market’s most dangerous months. The complete reversal of July’s gains on the major indices represents the most ominous sign of the transition. Technology stocks in particular have flipped from rocketships to anchors weighing on the … Read more

Bulls Fail Again at the Overbought Threshold – The Market Breadth

overbought threshold (Credit: Frustration by Leo Laporte on Flickr)

Stock Market Commentary The summer of loving stocks is staring down its second major test just two weeks after its first major test. Like the first test, the latest test is happening in the wake of the stock market’s failure to break through the overbought threshold on market breadth. Unlike the first test, the important … Read more

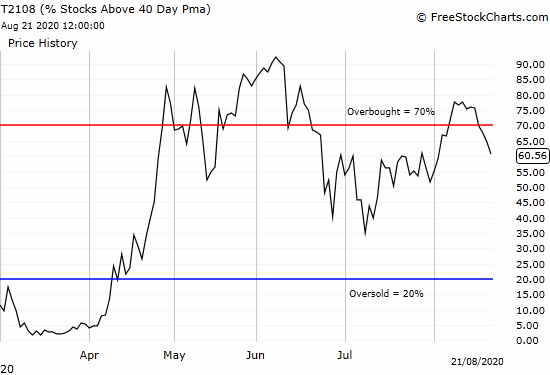
New Bearish Divergence Shreds the Stock Trading Script – Above the 40 (August 21, 2020)

AT40 (T2108) is dropping at a rapid clip despite the stock market's melt-up.

Stock Market Statistics AT40 = 60.6% of stocks are trading above their respective 40-day moving averages (DMAs) (ended 7 overbought trading days)AT200 = 42.7% of stocks are trading above their respective 200DMAs VIX = 22.5Short-term Trading Call: cautiously bearish Stock Market Commentary AT40 (T2108), the percentage of stocks trading above their respective 40-day moving averages … Read more

T2108 Update (November 6, 2015) – A Toppy Feeling In the Market Even As Individual Stocks Shine

(T2108 measures the percentage of stocks trading above their respective 40-day moving averages [DMAs]. It helps to identify extremes in market sentiment that are likely to reverse. To learn more about it, see my T2108 Resource Page. You can follow real-time T2108 commentary on twitter using the #T2108 hashtag. T2108-related trades and other trades are … Read more