
AT40 = 34.3% of stocks are trading above their respective 40-day moving averages (DMAs)
AT200 = 12.7% of stocks are trading above their respective 200DMAs
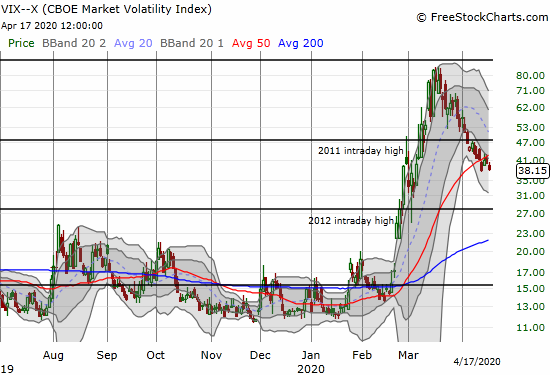
VIX = 38.2
Short-term Trading Call: cautiously bullish
Stock Market Commentary
Ever since the S&P 500 (SPY) bearishly broke down below its 50-day moving average (DMA) on February 24th, AT40 (T2108), the percentage of stocks trading above their respective 40DMAs, has traded under 40%. My favorite technical indicator is finally recovering toward 40% just as the S&P 500 is finally trading above its 50DMA again. This combination represents a recovery from a particularly damaging oversold episode. Many (most?) moving averages are in downtrends so it is easier for breakouts to happen.
I do not discount these breakouts because they are visual reminders of recovery. Just as the 20DMA breakouts of almost two weeks ago led the way out of oversold conditions, 50DMA breakouts represent the next big stock market moment.
The Stock Market Indices
The S&P 500 (SPY) marginally broke out above its 50-day moving average (DMA) on a 2.7% gain. The index maintained upward momentum through its upper Bollinger Band (BB) trading channel.

The NASDAQ (COMPQX) finally under-performed with a 1.4% gain, but it is still leading the way higher. The NASDAQ is at a 6-week high and confirmed its 50DMA breakout. The tech-laden index is in a very bullish position.

Volatility
The volatility index (VIX) is sticking to its downward trending lower Bollinger Bands (BBs). The fear gauge lost 4.9% and retested its low for the week. The VIX has surprisingly shown very little signs of life since its peak last month. This steady drip downward is another bullish sign. I am primed to fade the next pop.
The Short-Term Trading Call
This historic oversold period is starting to fade in the rear view mirror. Latecomers to the rally face difficult choices since the odds of some kind of pullback seem high at this juncture. Fortunately, the 50DMAs give latecomers an easy reference point for quickly stopping out of positions. Both the S&P 500 and the NASDAQ offer tight stops for swing trades.
My bullish trading strategy remains the same. There are still stocks that are testing and winning 20DMA support levels; these setups have become my favorite targets. This week, I will be focused more on bullish 50DMA breakouts especially after earnings have been announced for a particular company.
Stock Chart Reviews – Below the 50DMA
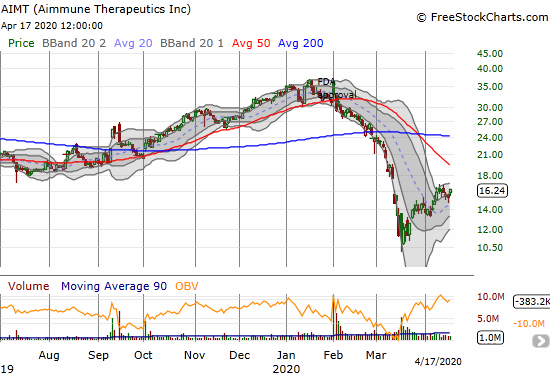
Aimmune Therapeutics (AIMT)
I reluctantly took profits on my position in Aimmune Therapeutics (AIMT) in February after the stock failed to stay aloft after the good news of FDA approval. I forgot to put the stock on the shopping list during the oversold period. Now, I will start re-accumulating stock at a higher price, but even these levels still look like a steal for a company working hard to provide solutions to food allergies.
Valero Energy (VLO)
Valero Energy (VLO) became another example of the recent power of 20DMA support as it rebounded for a 15.0% gain. I missed the opportunity because I took profits on shares in the previous rally. I am still in a long-term calendar call spread.

Stock Chart Reviews – Above the 50DMA
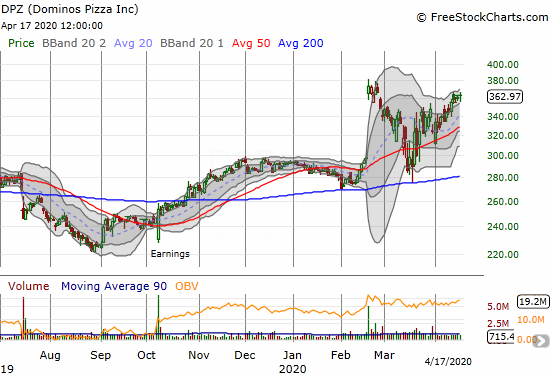
Dominos Pizza (DPZ)
Of all the casual dining and fast food stocks I am tracking, pizza seems to be doing the best. Dominos Pizza (DPZ) barely broke a sweat during the stock market’s collapse. DPZ pulled off a picture-perfect test of 200DMA support and is now re-challenging its all-time high.
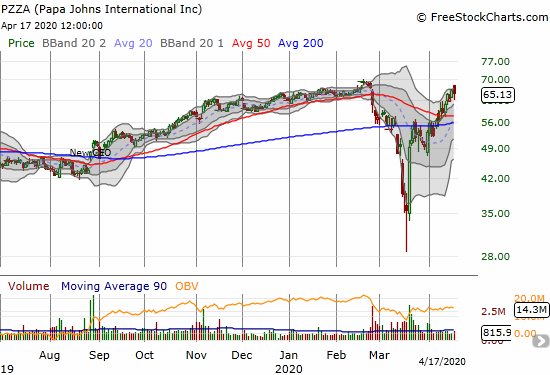
Papa John’s International (PZZA)
Papa John’s International (PZZA) did break a sweat during the collapse in the stock market. However, its rebound from a 7-year intraday low has been just as sharp as the preceding sell-off. Last week PZZA challenged its 2 1/2 year high. If pizza can survive the pandemic, surely other casual dining experiences can and will survive.
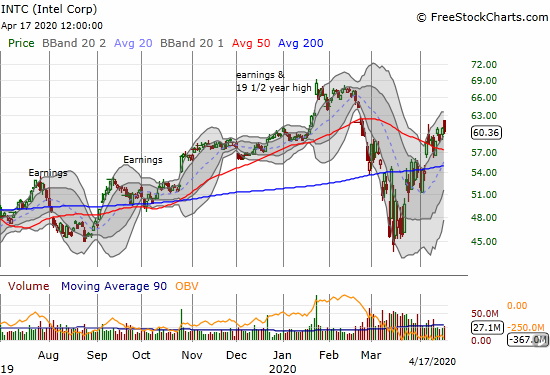
Intel (INTC)
After an earlier false start, Intel (INTC) last week confirmed a 50DMA breakout. Intel’s relative strength is part of an overall display of resilience in semiconductors. I am eagerly awaiting the stock market’s reaction to earnings on April 23rd.
— – —
FOLLOW Dr. Duru’s commentary on financial markets via email, StockTwits, Twitter, and even Instagram!
“Above the 40” uses the percentage of stocks trading above their respective 40-day moving averages (DMAs) to assess the technical health of the stock market and to identify extremes in market sentiment that are likely to reverse. Abbreviated as AT40, Above the 40 is an alternative label for “T2108” which was created by Worden. Learn more about T2108 on my T2108 Resource Page. AT200, or T2107, measures the percentage of stocks trading above their respective 200DMAs.
Active AT40 (T2108) periods: Day #4 over 20% (overperiod), Day #1 over 30% (overperiod ending 35 days under 30%), Day #48 under 40%, Day #39 under 50%, Day #58 under 60%, Day #62 under 70%
Daily AT40 (T2108)
")
Black line: AT40 (T2108) (% measured on the right)
Red line: Overbought threshold (70%); Blue line: Oversold threshold (20%)
Weekly AT40 (T2108)

*All charts created using FreeStockCharts unless otherwise stated
The T2108 charts above are my LATEST updates independent of the date of this given AT40 post. For my latest AT40 post click here.
Be careful out there!
Full disclosure: long SSO shares, long VLO calendar call spread
*Charting notes: FreeStockCharts stock prices are not adjusted for dividends. TradingView.com charts for currencies use Tokyo time as the start of the forex trading day. FreeStockCharts currency charts are based on Eastern U.S. time to define the trading day.