Shake and Bake Does A Bottom Make – Above the 40 (February 28, 2020)
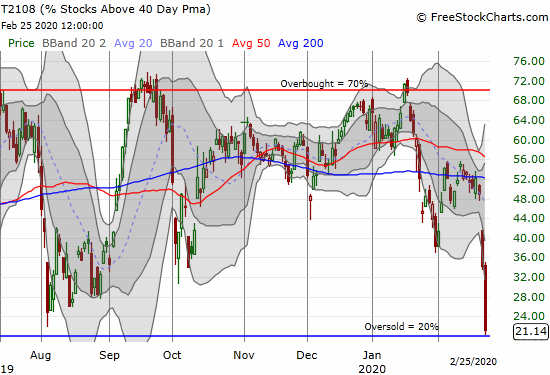
AT40 = 7.0% of stocks are trading above their respective 40-day moving averages (DMAs) (oversold day #3, dropped as low as 5.1%)AT200 = 21.4% of stocks are trading above their respective 200DMAs (13-month low, dropped as low as 17.8%)VIX = 40.1 (was as high as 49.5%)Short-term Trading Call: bullish Stock Market Commentary Oversold I had … Read more