
AT40 = 57.4% of stocks are trading above their respective 40-day moving averages (DMAs)
AT200 = 54.9% of stocks are trading above their respective 200DMAs
VIX = 12.1
Short-term Trading Call: neutral
Stock Market Commentary
The stock market seems to be on a slow and steady march toward Christmas. The current bearish divergence and an exceptionally low volatility index should offer reasons for pause. Yet as with so many bearish signals during a bullish run, the red flags do not matter until they do.
The Bearish Divergence
The S&P 500 (SPY) is still in the bearish divergence I described near the end of October. Since then, the index has broken out to multiple all-time highs. However, AT40 (T2108), the percentage of stocks trading above their respective 40-day moving averages (DMAs), is slightly lower over that time and far from the overbought threshold (70%). Most importantly, AT40 spent the entire week declining from 63.7% to 57.4% while the S&P 500 broke out Friday to a fresh all-time high.
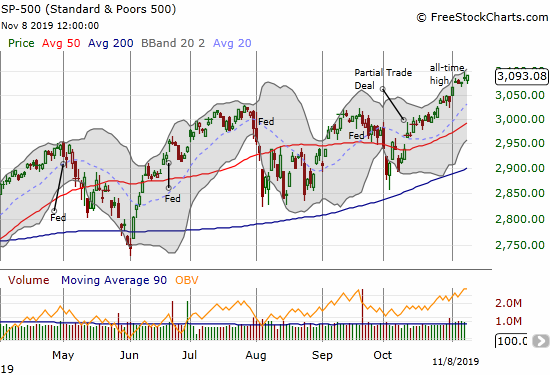
The divergent paths of the major indices and AT40 provide a bearish signal because together they indicate a narrowing rally; fewer and fewer stocks are participating. On the other hand, the longer this bearish divergence lasts, the more resilient (and stubborn) the market looks. That is, buyers get ever more confident even as they crowd into fewer and fewer leaders. So I am looking out for two distinct outcomes: 1) a mild pullback to the uptrending 50DMA (conveniently sitting at 3000 and a near reversal of the post Partial Deal euphoria) after buying the leaders finally exhausts itself, or 2) a continuation of the drift higher through a Santa Claus rally in December. These potential outcomes keep my short-term trading call solidly locked on neutral.
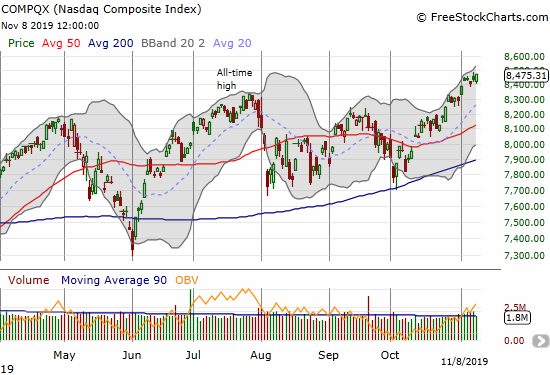
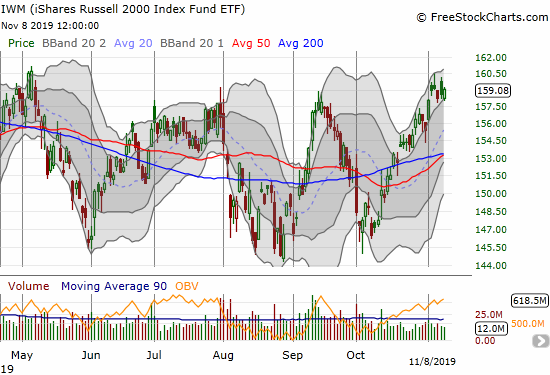
The iShares Russell 2000 Index Fund ETF (IWM) is drifting higher along with the S&P 500 and the NASDAQ. Yet the index of small-caps is still yet to breakout. IWM offers the perfect “catch-up” opportunity. After my last success in buying IWM calls, I am looking to load up again in the coming week to satisfy the bullish side of my neutral trading call.
Volatility
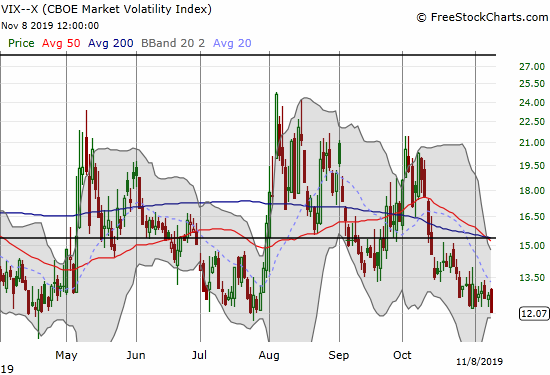
If there is anything to worry about, volatility is waving a yellow flag of caution. Complacency reached a new extreme with the volatility index (VIX) dropping to 12.1. The stock market reached this depth of complacency twice before this year. Both times directly preceded big volatility breakouts. I previously swore off going long volatility for the rest of the year, however, this kind of discount is irresistible. I will be looking to get long VIXY or UVXY call options in the coming week with a December expiration. Having these calls as a backstop will allow me to shop for buying opportunities with more confidence.
Stock Chart Reviews – Below the 50DMA
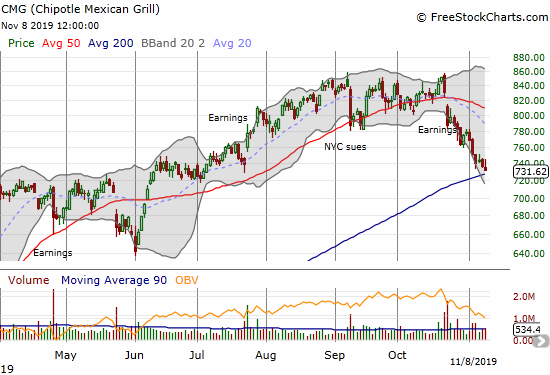
Chipotle Mexican Grill (CMG)
Chipotle Mexican Grill (CMG) is on a slide toward 200DMA support. I identified the prospects for such selling after sellers followed through on the bearish post-earnings 50DMA breakdown. Per my plan, I chased the stock downward. I was short stock for half of the trip, and I am on my second tranche of put options. An initial bout of buying on Friday lured me into buying a call in case CMG managed a rebound from this critical visit to 200DMA support.
CMG last touched its 200DMA when it broke out to start the year. Simply playing that breakout would have delivered a 60.8% year-to-date gain even with the current pullback. That performance serves as a great reminder of the potential of playing 200DMA breakouts to the long side.
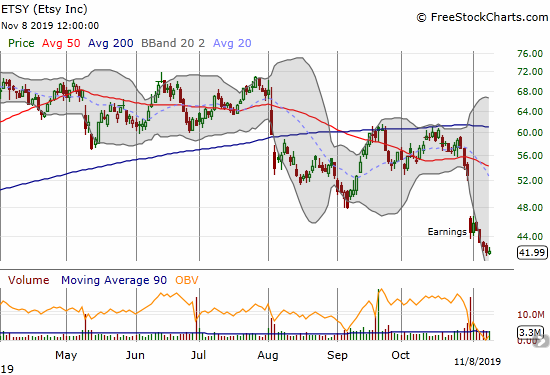
Etsy (ETSY)
I have never understood the market’s willingness to pay such a high valuation for Etsy (ETSY). The stock has finally topped out with a 15.7% post-earnings loss that confirmed a 50DMA breakdown. ETSY formed an extended topping pattern from March to July that I completely missed. I also missed the August 200DMA breakdown which ETSY never reversed. The stock failed twice at 200DMA resistance in September and then in October.
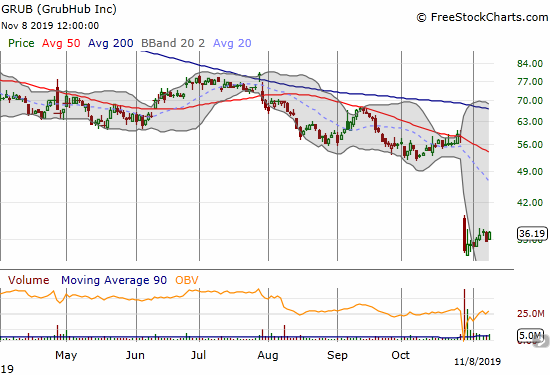
GrubHub (GRUB)
I largely gave up on food delivery services because of a series of bad experiences. I was particularly dissatisfied with the general lack of responsibility between the restaurant and the delivery service when something goes wrong. I finally dove back in to take advantage of a free delivery offer from Chili’s which uses Door Dash as its delivery arm. The service was fine…but the driver used a little girl to to do the hand-off! I was taken aback but managed to crack a joke: “I hope you didn’t drive here!?!”
Anyway, needless to say I am not surprised that investors are throwing in the towel on GrubHub (GRUB). The stock lost a gut-wrenching 43.3% after posting earnings that missed the mark: Q4 revenue guidance cut well below “consensus” and EBITDA slashed to to $15-25M versus consensus expectations of $79.2M. GRUB is increasing investment in its business at a time when the competition continues to heat up in the industry. The money pit seems to be ever deeper.
Back in May, I used GrubHub’s valuation to estimate a good entry point for buying Uber (UBER). The method worked for a short-term trade. GRUB now sells for just 2.7 times sales (according to Yahoo Finance) while UBER is at 3.1. The parallels continue.
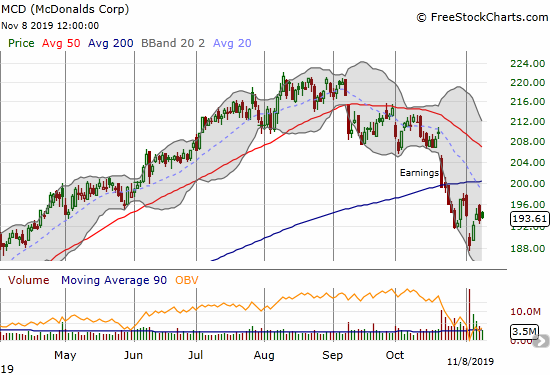
McDonalds (MCD)
McDonalds (MCD) demonstrated the power of playing a 200DMA breakdown from the short side. I pointed out the setup last month. When the week started with a gap down on news of the CEO’s dismissal for having a consensual affair with an employee, I was ready with put options and a Nov/Dec calendar put spread at the $190 strike. I immediately took profits on the straight put options. I suspect the selling is a bit washed out for now – volume has been very high since the 200DMA breakdown with a climax on the gap down – and I think the $190 level could become a new pivot before selling resumes (perfect for my put spread setup).
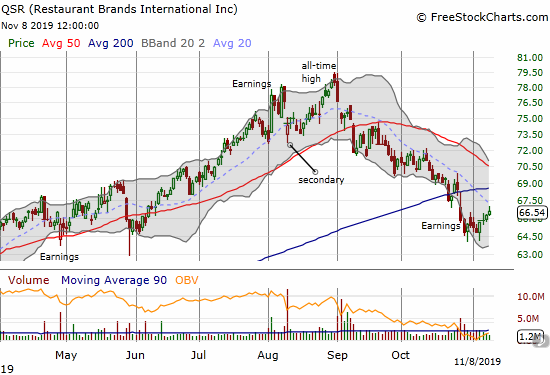
Restaurant Brands International (QSR)
At the height of a chicken sandwich craze I made the case for buying into Restaurant Brands International (QSR). Soon after that piece, a dip arrived in the form of a test of 50DMA support off a visit to a new all-time high. In less than two months, QSR also sliced through 200DMA support, and a poorly received earnings report confirmed a 200DMA breakdown. While it looks like the casual dining sector is under pressure, I am sticking to QSR as a buy. I am eyeing a fresh entry point, but there is of course no rush with the stock trading below its 200DMA.

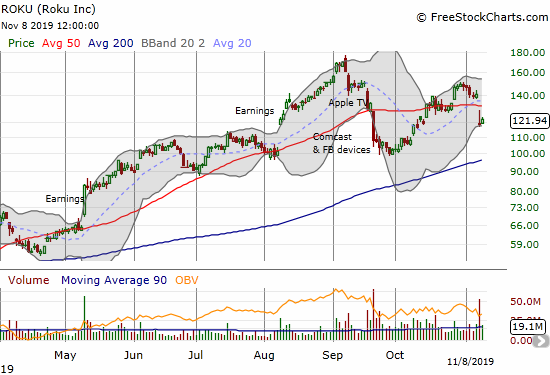
Roku (ROKU)
Roku (ROKU) made a picture-perfect bounce off the $100 level in September. The subsequent relief rally surprised me with the 50DMA breakout. That rally stalled perfectly at the consolidation point that preceded the last bout of selling. A post-earnings 16.0% loss and a 50DMA breakdown launched a pending confirmation of a top for ROKU. I played this latest swing with weekly calendar spreads of calls and puts, $122 and $115 strikes. The 2.9% gain on Friday delivered profits on the call side. I am now sitting on a put option. If ROKU manages another 50DMA breakout, I will aggressively chase the stock higher.
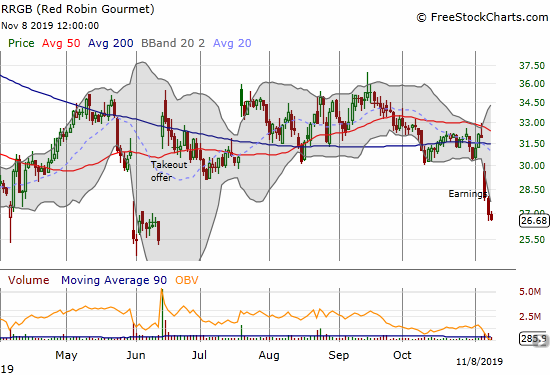
Red Robin Gourmet (RRGB)
Red Robin Gourmet (RRGB) did NOT play out as expected. The exact opposite happened with a poorly received earnings report leading to a near reversal of the takeout gap up from June. I took for granted that this offer was enough and never once thought that the stock’s lack of momentum was a cause for concern. I did not see any mention in the transcript of the earnings call of the standing take-out offer from Vintage capital, but I did read plenty of talk from management about a successful turn-around effort. Investors clearly think otherwise.
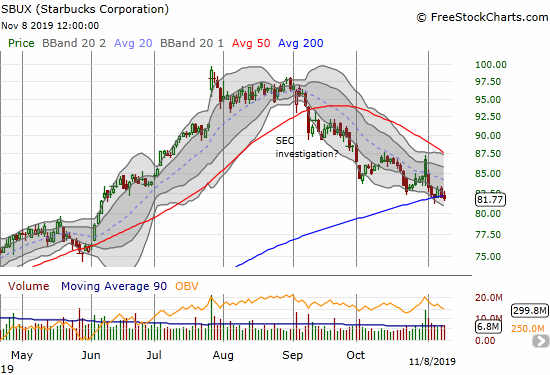
Starbucks (SBUX)
I took profits on my Starbucks (SBUX) puts in early October. I never returned to trade SBUX to the downside. I now see SBUX’s weakness in the larger context of pressure on food/beverage outlets that rely on discretionary spending. So many of these stocks simply got too “expensive” from a valuation standpoint while investors tried to “hide” from Trade War volatility.
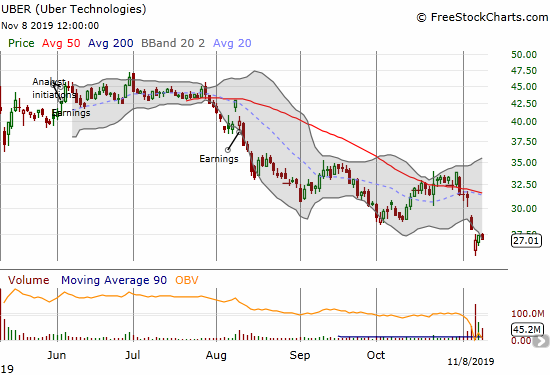
Uber (UBER)
Given an imminent lock-up expiration, I figured the earnings report from Uber (UBER) would be explosive. Ahead of earnings, the options market priced in about a 10% move. I thought that UBER was as likely to make a contrarian move (short-covering) as a confirming one so I tried a combination of options: a calendar call spread at the +10% point and a put spread with the short side tagged at the -10% level. I netted a small profit after sellers took UBER to a second gap down on the lock-up expiration. The combination of the volume surge and the subsequent buying off the bottom makes UBER looks like it has bottomed. I bought shares the next day after buyers stepped in again. I am using a principle of bottom fishing: “Anatomy of A Bottom: Do Not Argue With Sellers – Celebrate With Buyers.”
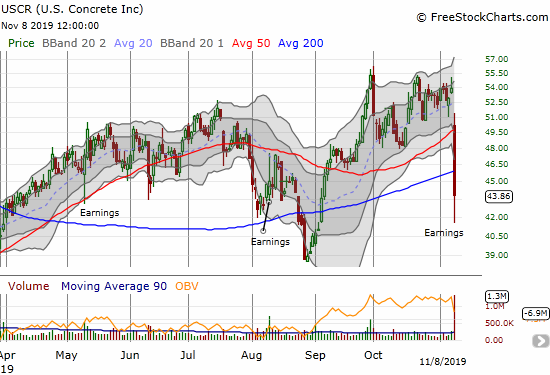
U.S. Concrete (USCR)
U.S. Concrete (USCR) continues to produce volatile post-earnings results. I have yet to catch up on the earnings trajectory of USCR, but I suspect the latest bout of angst is yet another buying opportunity. I am looking to start nibbling again closer to the August low.
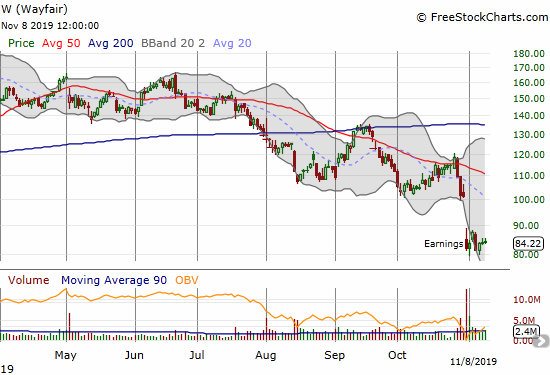
Wayfair (W)
Wayfair (W) is yet another high-flyer that has topped out. Wayfair’s 18.6% post-earnings loss finished wiping out its gains for the year. Wayfair peaked in March with a mind-boggling 90% year-to-date gain at that time.
Stock Chart Reviews – Above the 50DMA
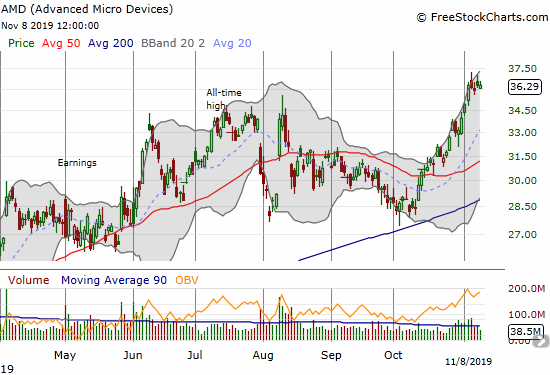
Advanced Micro Devices (AMD)
Advanced Micro Devices (AMD) is back on a bullish run after a successful test of 200DMA support last month. While the subsequent 50DMA breakout confirmed the return of the buyers, I still waited before making a trade. I was tentative because of earlier failures trading AMD. This time was a charm as I bought right at the November 1st breakout to an all-time high. I took that move as another confirmation of upward momentum. I sold the call options on Tuesday as the price already doubled and the stock was stretching above its upper Bollinger Band (BB).
AMD demonstrates how bullish runs allow successful trades on upside breakouts.
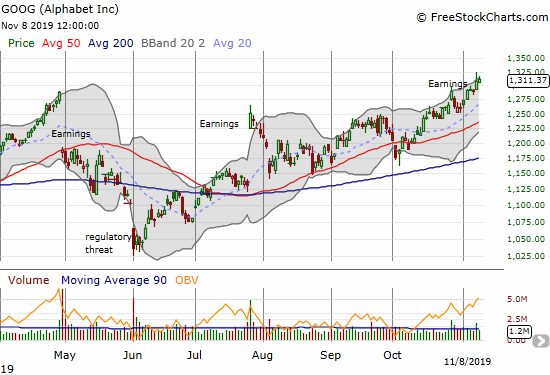
Alphabet (GOOG)
Alphabet (GOOG) “quietly” nudged its way to a new all-time high last week. I say quietly because sellers stepped in yet again after Alphabet reported earnings. The scene looked like a repeat of July. However this time the selling was even more shallow and buyers quickly took control again. GOOG is finally the leader of the FANG stocks (Facebook, Amazon.com, Netflix, and Google) as the other three members languish well below their all-time highs.
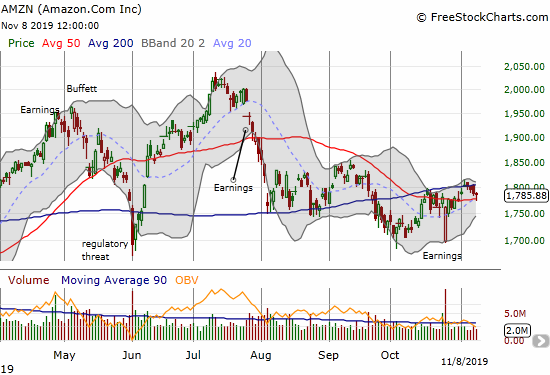
Amazon.com (AMZN)
Amazon.com (AMZN) just looks tired. While buyers eagerly bought up the stock from its post-earnings intraday low last month, the follow-on buying has been tepid. AMZN even spent last week drifting lower while the stock market continued to rally. I will not be surprised to see AMZN drift around and between its 50 and 200DMAs for weeks to come.
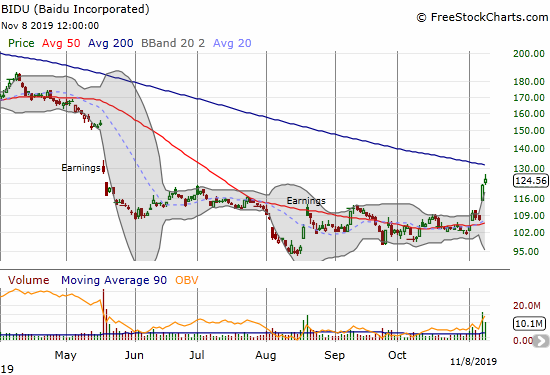
Baidu (BIDU)
With optimism building over the U.S. vs China Trade War, Baidu (BIDU) looked like an “obvious” trade. Yet, I was not confident enough to buy ahead of earnings. BIDU delivered on earnings, and I rushed in to buy a December $120/$130 call spread. I am targeting a test of declining 200DMA resistance.
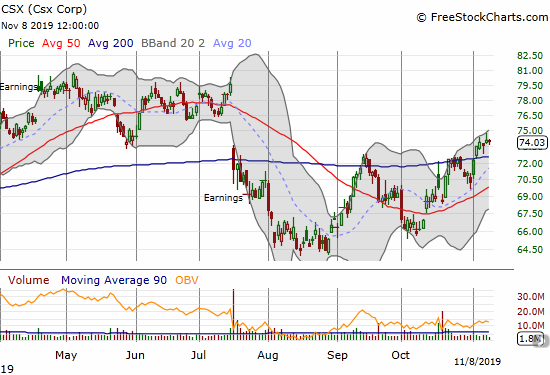
Csx (CSX)
Csx (CSX) is a buy on its 200DMA breakout. I bought shares and a calendar call spread for a combination I am testing on several trades. Too often I find myself under-estimating upside potential with a calendar call spread quickly going into the money. The shares provide profit on the continuation of the upward momentum. I have also bought calls above the strike price of the calendar call spread to accomplish a similar goal. I am targeting CSX for a run to the $80 level after the coming November options expiration. My spread is at the $75 strike.
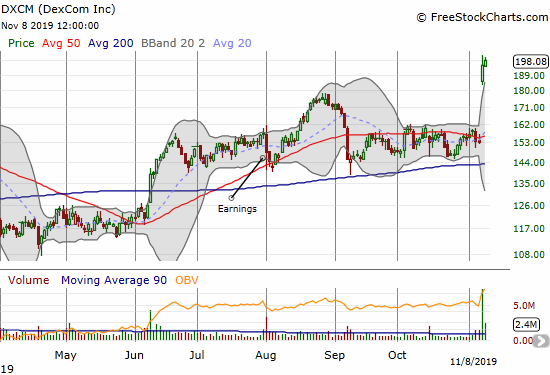
DexCom (DXCM)
I was starting to think that the tea leaves on DexCom were false. In June, I assumed a swift run-up and breakout signaled “something” big was coming. After a failed trade with options, I decided to just buy shares when the stock broke out again in August. The stock soon pulled back to 200DMA support. I bought more shares. After an extended struggle with 50DMA resistance, I was starting to think I was missing something. DXCM finally delivered with a monster 27% post-earnings gain last week. If not for all the churn to get to this point, I would have been content to sit on the position for a while to look for follow-through. Instead, I just took the profits. DXCM is still a buy on the dips.
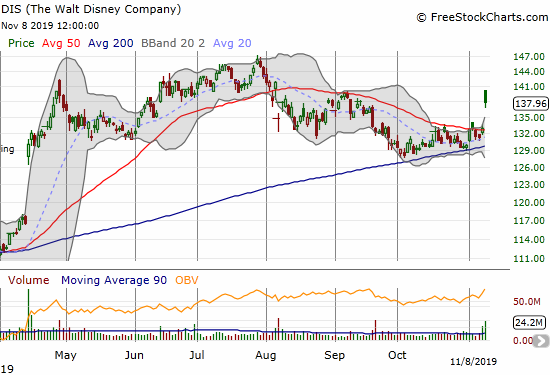
Disney (DIS)
Disney (DIS) resolved its triangle or wedge pattern to the upside with a post-earnings gap up. DIS is now a clear buy with a stop below its 50 or 200DMA. I prefer to buy once the stock is no longer stretched out above its upper Bollinger Band (BB).
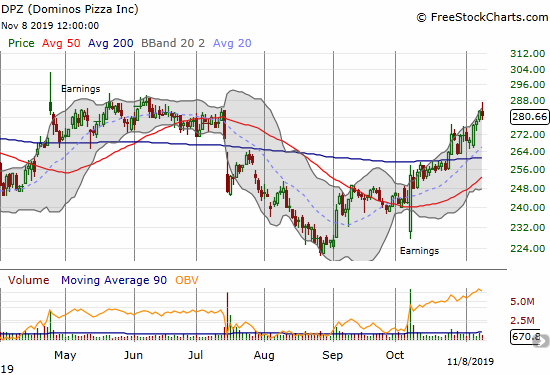
Dominos Pizza (DPZ)
Dominos Pizza was another 200DMA breakout buy. I planned to sit on the stock and managed to sit through a pullback toward 200DMA support. However, after noticing the growing pressures on industry peers in casual dining, I pulled the trigger on the next pullback. That selling was also short-lived and DPZ even further benefited from sympathy buying in the wake of well-received earnings from Papa Johns (PZZA). DPZ now sits under critical resistance from the spring/summer highs.
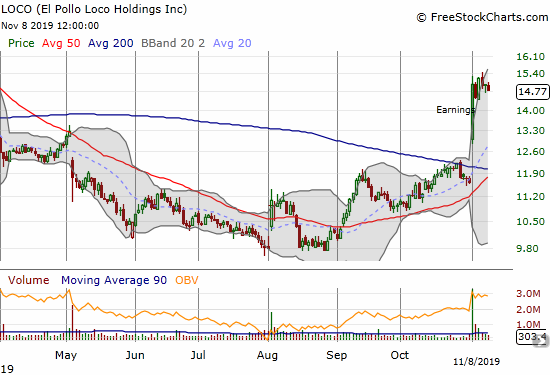
El Pollo Loco Holdings (LOCO)
I took profits on El Pollo Loco Holdings (LOCO) in October. I considered myself fortunate to time the latest bottom in the stock. LOCO’s post-earnings surge validated my underlying bullishness in the stock, but of course I strongly prefer validation with stock still in hand!
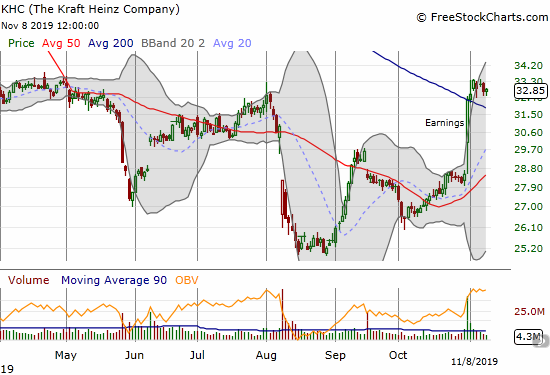
The Kraft Heinz Company (KHC)
The recovery in The Kraft Heinz COmpany (KHC) has been quite choppy. A big post-earnings surge finally took the stock to 200DMA resistance. A trickle of follow-on buying took the stock over the hump for a bullish, yet unconvincing, 200DMA breakout.I am a buyer on a fresh breakout. Until then, I think there is plenty of risk of a reversal.
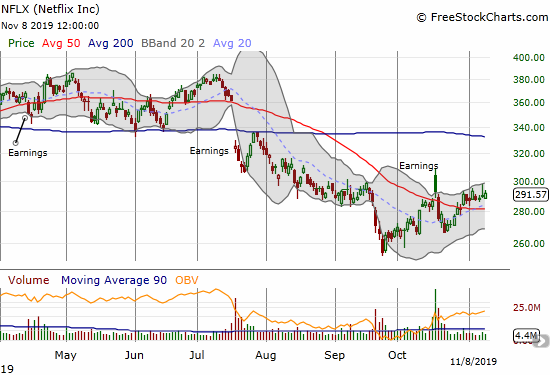
Netflix (NFLX)
Netflix (NFLX) is surprisingly hanging tough. Downward momentum has clearly stopped and now the path of least resistance looks higher, or at least a drift higher. I am staying short though as I look further out into the future. The stock is too listless to make buying hedging calls worthwhile (a calendar call spread might soon be worthwhile).
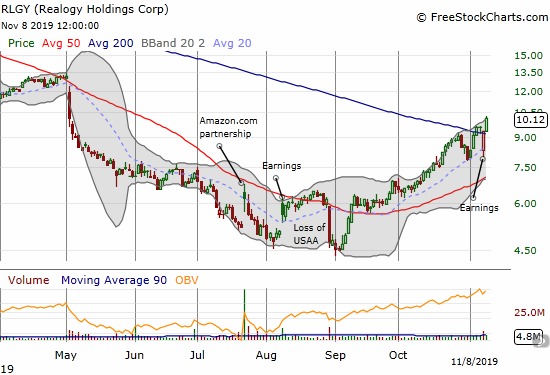
Realogy (RLGY)
I tried my best to ignore Realogy (RLGY), but the persistent buying in this stock is hard to ignore. I bought stock in the late October pullback and paired it with puts as a hedge. As I suspected, the stock resumed its rally into earnings. I took profits on the shares at 200DMA resistance. RLGY pulled back post-earnings but not enough to deliver profits on the puts. Moreover, buyers stepped right into the breach. Friday’s follow-on buying for an 8.5% gain puts RLGY on firm bullish footing. I will be looking to buy into the stock again…with puts as a backstop. What could have been if the August news of USAA did not stop me out of my bottom-fishing play!
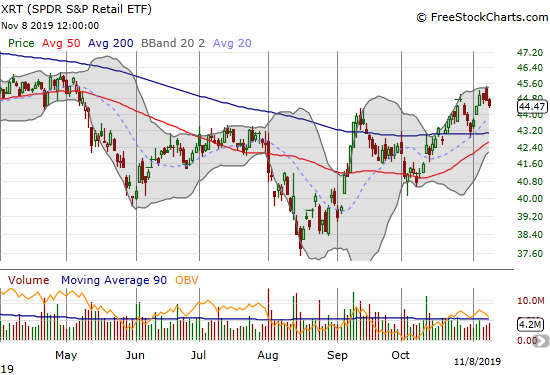
SPDR S&P Retail ETF (XRT)
The SPDR S&P Retail ETF (XRT) is once again lagging the S&P 500 (SPY). The current choppy rally only has XRT at a 6-month high. Still, with a successful test of 200DMA support in the rearview mirror and a rapidly ascending 50DMA, XRT looks like the classic stocking-stuffer ahead of what could be next month’s “Santa Claus rally.” Santa just needs to finish climbing that ladder and climb over the bearish divergence.
— – —
FOLLOW Dr. Duru’s commentary on financial markets via email, StockTwits, Twitter, and even Instagram!
“Above the 40” uses the percentage of stocks trading above their respective 40-day moving averages (DMAs) to assess the technical health of the stock market and to identify extremes in market sentiment that are likely to reverse. Abbreviated as AT40, Above the 40 is an alternative label for “T2108” which was created by Worden. Learn more about T2108 on my T2108 Resource Page. AT200, or T2107, measures the percentage of stocks trading above their respective 200DMAs.
Active AT40 (T2108) periods: Day #208 over 20%, Day #47 over 30%, Day #22 over 40%, Day #19 over 50% (overperiod), Day #3 under 60%, Day #35 under 70%
Daily AT40 (T2108)
")
Black line: AT40 (T2108) (% measured on the right)
Red line: Overbought threshold (70%); Blue line: Oversold threshold (20%)
Weekly AT40 (T2108)

*All charts created using FreeStockCharts unless otherwise stated
The T2108 charts above are my LATEST updates independent of the date of this given AT40 post. For my latest AT40 post click here.
Be careful out there!
Full disclosure: long VIXY calls, long RLGY puts, long UBER, long QSR, long CMG put spread, long CMG call, short NFLX, long MCD put calendar spread, long BIDU call spread, long ROKU put, long RRGB
*Charting notes: FreeStockCharts stock prices are not adjusted for dividends. TradingView.com charts for currencies use Tokyo time as the start of the forex trading day. FreeStockCharts currency charts are based on Eastern U.S. time to define the trading day.