Nike Kicks Amazon.com Into Bearish Territory
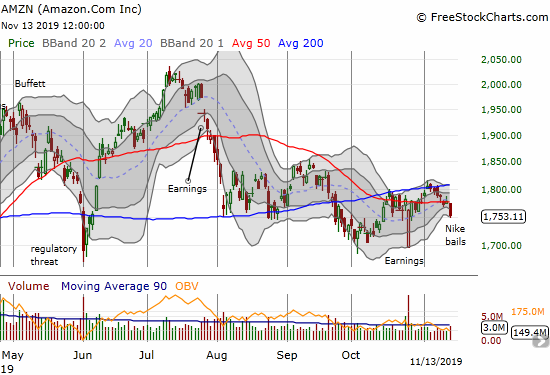
A Failed Pilot “…with a direct partnership, Nike will be able to ‘elevate the way the brand is presented’ by gaining more control over how its products are marketed on the site…” Former Nike CEO Mark Parker quoted in CNN Business (June 29, 2017) In 2017, the Nike (NKE) pilot with Amazon.com (AMZN) held a … Read more