
AT40 = 59.4% of stocks are trading above their respective 40-day moving averages (DMAs)
AT200 = 53.1% of stocks are trading above their respective 200DMAs
VIX = 12.7
Short-term Trading Call: neutral (see below)
Stock Market Commentary
A Sufficient Resolution
I still harbor lingering skepticism, but the S&P 500’s recovery from the last hiccup and its subsequent slow and steady push higher is undermining my resolve. I finally relented earlier last week and reluctantly changed my cautiously bearish short-term trading call to neutral. I will keep my position at neutral even to and through overbought trading conditions. On Friday, the index tantalizingly closed three points short of the all-time high after trading right to the intra-day all-time high (apparently President primed the pump once again with promises of good progress on the getting the Partial Trade Deal signed).
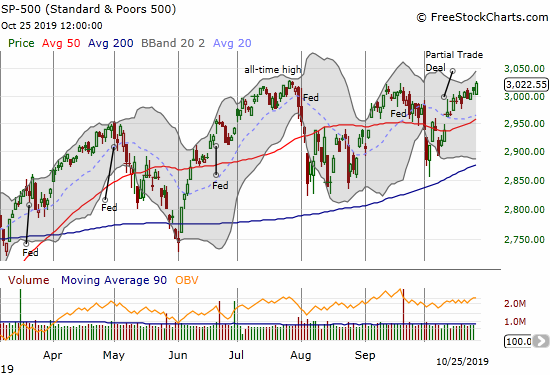
AT40 (T2108), the percentage of stocks trading above their respective 40-day moving averages (DMAs), is again not keeping pace with the S&P 500. My favorite technical indicator closed the week at 59.4% and could not even beat Wednesday’s closing high of 60.8%. When AT40 crossed the 60% threshold, I shifted to a neutral stance. I thought AT40 was ready to make a bull run for the overbought threshold of 70%. AT40’s lag behind the S&P 500 signals a narrowing rally which should intensify the magnitude/speed of the next pullback…whenever it comes. My changed short-term trading call is a concession to price action alone and a recognition that a narrowing rally can continue for quite some time before it falls apart.
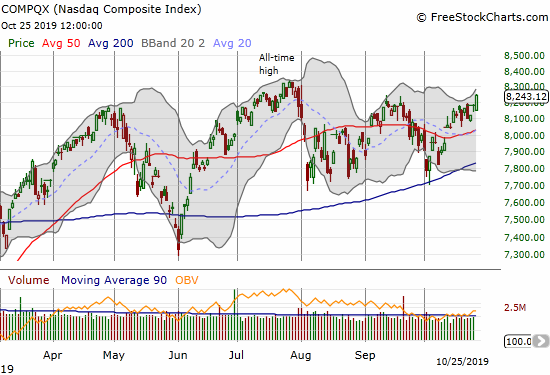
The NASDAQ (COMPQX) still has some work ahead to challenge its all-time high from July. Like the S&P 500, the tech-laden index looks like it is working on a springboard from 200DMA support.
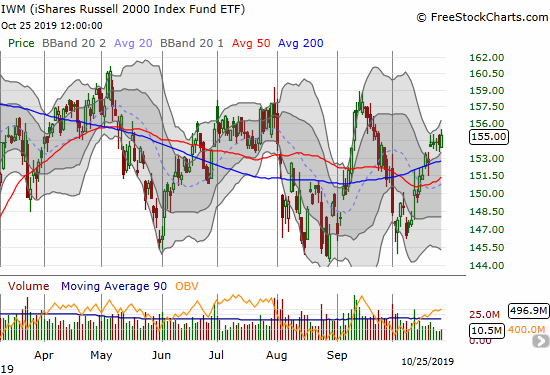
The iShares Russell 2000 Index Fund ETF (IWM) has a LOT of work ahead. Its 200DMA still looks more like a pivot rather than a springboard. However, if the stock market rally continues, I think “bargain hunters” will eventually crowd back into small caps. I am looking to buy November or December calls in IWM in the coming week and possibly accumulate after any post-Fed hiccup.
Volatility
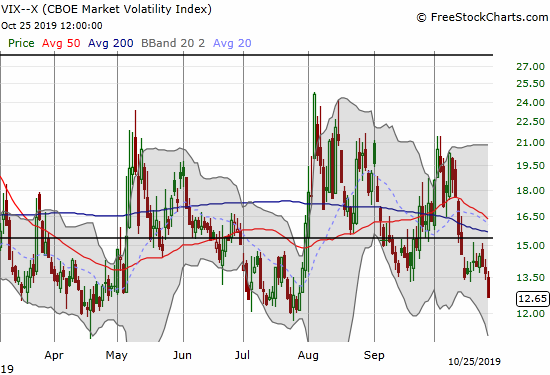
The volatility index (VIX) put an exclamation point on the market’s changing sentiment. The VIX plunged to 12.7 on Friday and now looks set to challenge levels of complacency last seen in July. While this move underlines the bullish sentiment in the market, it also produced perfect conditions for going long volatility on the cheap ahead of the Federal Reserve’s next declaration on monetary policy on October 30th. I am still holding some decaying VIXY call options and will look to refresh them by Tuesday.
Stock Chart Reviews – Below the 50DMA
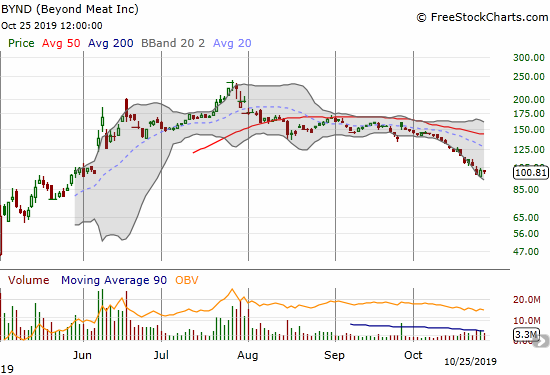
Beyond Meat (BYND)
Beyond Meat (BYND), the “fake meat” company, has earnings and a lock-up expiration coming up this week. The chart tells me that sellers have tried their best to price in the resulting risks and dangers ahead. Still, I decided to buy a Nov 1/Dec 15 $80 calendar put spread to play a potential continuation of the slide with a notable discount on the Dec $80 put I really want. I will jump to the long side if, as with some speculative stocks, the added liquidity of insider selling motivates buyers to step in. A relief rally should have legs at least to the downtrending 20DMA.
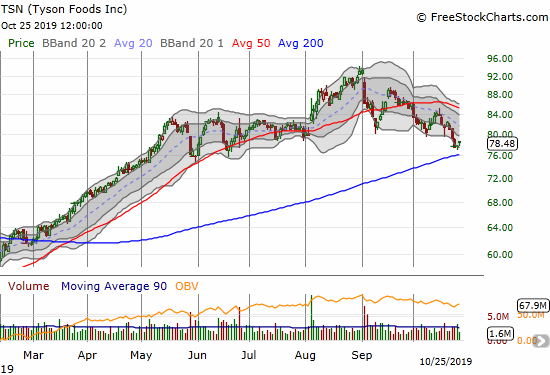
Tyson Foods (TSN)
Tyson Foods (TSN) printed a nice breakout in August but peaked at its last all-time high at the end of that month. The gains from the month-long breakout were erased in less than 2 weeks. TSN bounced orderly downward from there and is now close to a challenge of 200DMA support. Tyson Foods is commonly known for its chicken processing but is getting juice for its entry into the “fake meat” market. The company is one of many competitors lining up to take on upstarts like Beyond Meat. In other words the rich valuation of BYND is increasingly at risk: 388 forward P/E, 37 price/sales, and 18 price/book.
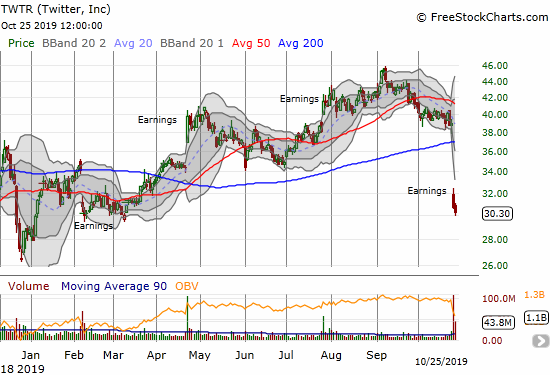
Twitter (TWTR)
Twitter (TWTR) dropped 20.8% post-earnings and the sellers tacked on another 1.5% for good measure on Friday. I have long stood by Twitter as a long-term, even if somewhat speculative and expensive, investment. I assumed this year’s gradual, albeit choppy, rise marked a key period of stabilization for the stock. So I did not bother protecting my position going into earnings beyond selling a Nov $45 call option against the position. I closed that call out and now look for the February/March lows to hold as support. A test of December support will motivate me to add to my position.
CNBC’s Options Action recommended a speculative play for a relief while issuing a very bearish overall outlook.
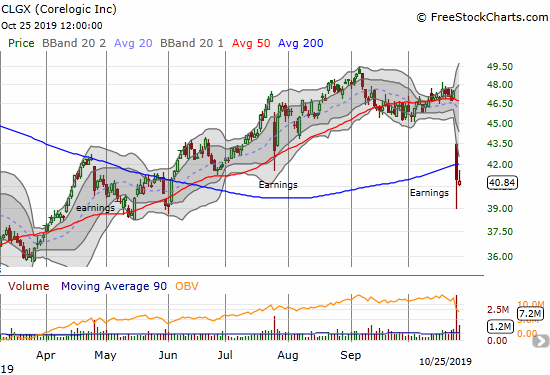
Corelogic (CLGX)
Corelogic is one of many housing-related stocks I monitor. The stock took a big tumble on Thursday into bearish territory with a 200DMA breakdown. The move wiped out 4 months of gains. I am scratching my head on this one as the company reaffirmed guidance yet something in the earnings report was so bad it motivated Deutsche Bank to quickly downgrade the stock to a sell. I will be reading up soon!
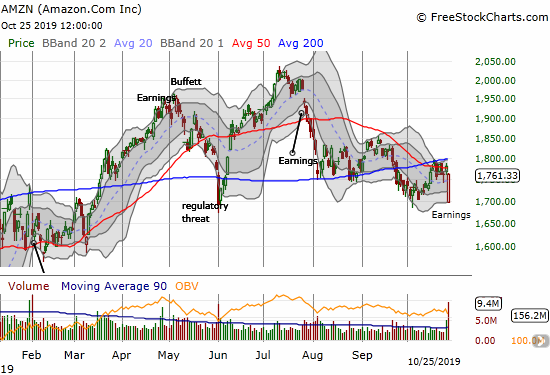
Amazon.com (AMZN)
I used to have an automatic post-earnings trade on Amazon.com (AMZN) that bought the post-earnings open. That strategy would have served me very well on Friday. AMZN traded down as much as 8% in Thursday’s after hours session but opened Friday down just 5%. Instead of interpreting the better open as evidence of buyer interest on the dip, I stretched for a calendar put spread to play a resumption of selling. I was late in moving for a hedging calendar call spread. Now I await a decisive move below May’s low or above 200DMA resistance.
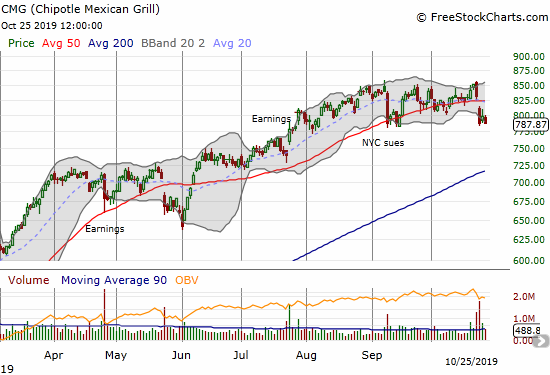
Chipotle Mexican Grill (CMG)
Chipotle Mexican Grill (CMG) broke below its 50DMA after earnings last week. Buyers looked ready to defend the stock the next day, but sellers returned on Friday. CMG is now teetering on an extended slide toward 200DMA support. I will chase it downward if the stock breaks last month’s low. CMG becomes bullish again on a close above its 50DMA.
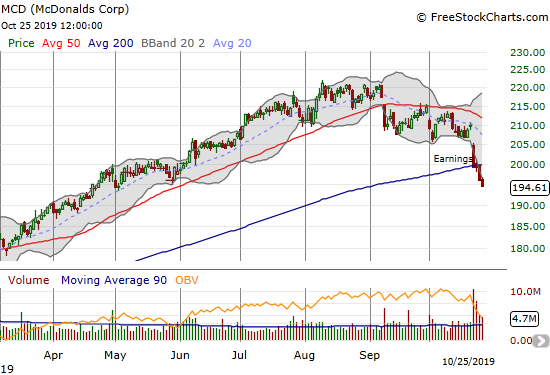
McDonalds (MCD)
McDonalds (MCD) was one of many “safety” staple stocks that rode out all sorts of market churn this year. Last month, the buyers finally ran out of gas as MCD broke down below its 50DMA and then proceeded to fail twice more at resistance. All those signals were red flags ahead of last week’s post-earnings sell-off. The selling has yet to stop with a confirmed 200DMA breakdown. Few “natural” lines of support exist for MCD until the March low. MCD also looks like it confirmed a topping pattern at its all-time high. The stock is a short until it can at least recover from the 200DMA breakdown.
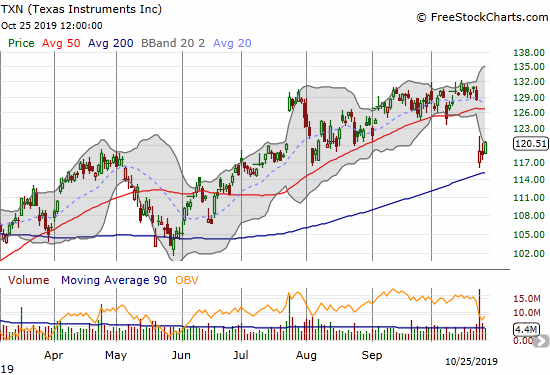
Texas Instruments (TXN)
The post-earnings 50DMA breakdown in Texas Instruments (TXN) seemed to signal a bad turn for semiconductors. Instead, semiconductor earnings after TXN turned sentiment right back around. Sellers failed to directly challenge 200DMA support, and now buyers are already regaining control. I like TXN for a relief rally to 50DMA resistance under the assumption Friday’s buying confirmed a “close enough” test of 200DMA support.
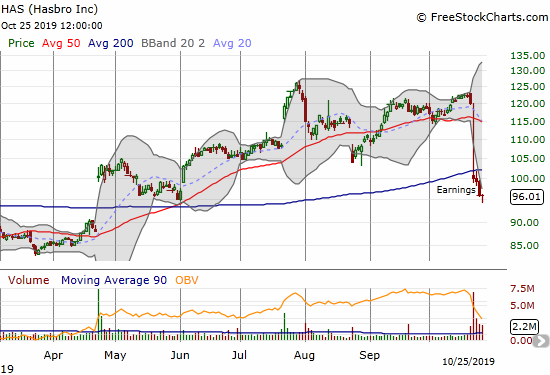
Hasbro (HAS)
I have a hard time understanding toy-marker and distributor Hasbro (HAS). Overall, the market has seemed satisfied with Hasbro’s navigation of the mine fields of the US vs China Trade War. HAS even hit a fresh all-time high in July. This time around, the reminders of still intact December tariffs seemed to undermine investor confidence. From the Seeking Alpha transcript:
“The Hasbro team is making progress to accomplish our stated goal of returning to profitable growth this year in an environment where the trade conflict is having the short-term impact we have outlined throughout the year to our stakeholders…
…the threat and implementation of tariffs negatively impacted our quarterly results. For the third quarter, U.S. point-of-sale declined slightly, and retailers continued to lower inventory. With many of our holiday initiatives launching in early fourth quarter point-of-sale has improved in recent weeks and is up to start the quarter.
As you recall, since the administration began discussing tariffs, we have outlined the ripple effect they would have on our business…
In the third quarter, the threat of, and the implementation of tariffs in certain instances, impacted our shipments, and our ability to fully meet demand. Importantly, during Q3 alone we saw multiple different dates for the enactment of List 4 tariffs come and be delayed, now scheduled for December 15 and yet the prospect had our retailers cancel major direct import program orders and rewrite many of those orders as domestic shipments. The impact of the shift was that July and August total shipments were lower and September shipments were far higher than a year ago.
However, given the location of our inventory in Asia to satisfy direct import orders during July and August, we ultimately were unable to re-plan the orders and rewrite all of the orders from direct import to domestic orders all within the quarter.
We were also unable to ship all the orders, many of which came late in September, by the end of the quarter.“
The result was a bearish and confirmed 200DMA breakdown. If Hasbro manages to navigate its way out of this Trade War chaos, then the stock could become a strong buy on a close above its 200DMA.
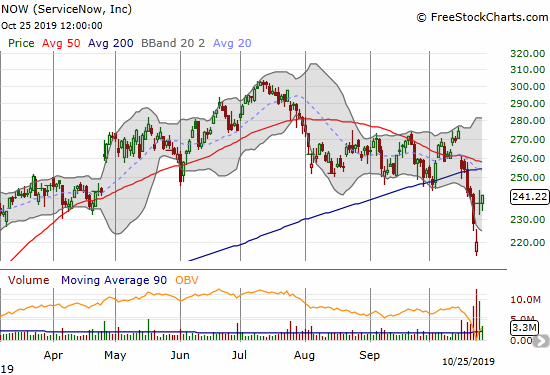
ServiceNow (NOW)
ServiceNow was a head-spinner last week. The stock suffered a major and bearish breakdown out of a trading range roughly defined by converging 50 and 200DMAs. News of leadership changes pushed the stock below its lower Bollinger Band (BB). Earnings reported that evening gapped the stock higher the next day. The pattern created an abandoned baby bottom that “trapped” shorts who chased the stock downward and created instant regret for sellers. This pattern is a buying signal, but I am content to wait to see whether buyers can push through now converged resistance from the 50 and 200DMAs.
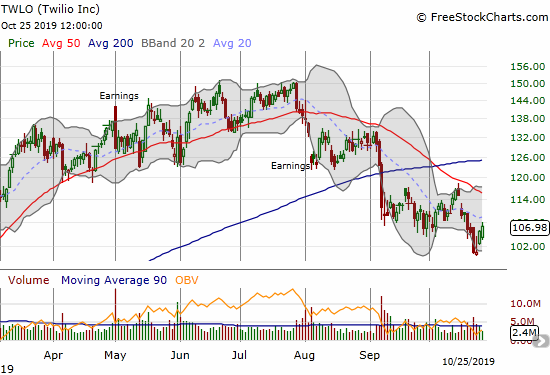
Twilio (TWLO)
Twilio (TWLO) has effectively led growth software stocks lower. TWLO peaked with a June/July double top. The stock lost a third of its value from that peak when it hit $100 last week. That level was too obvious to resist and buyers stepped in to bounce the stock. With confirmed 50 and 200DMA breakdowns, TWLO has a LOT to prove before it becomes a buy again.
Stock Chart Reviews – Above the 50DMA
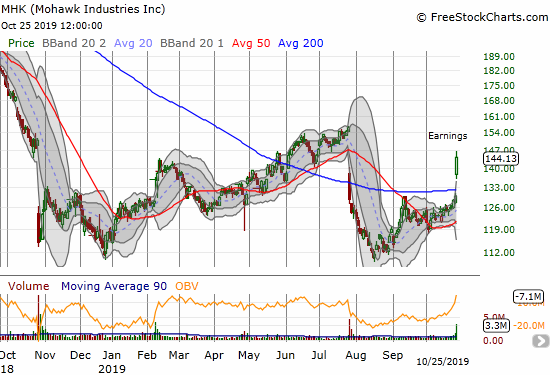
Mohawk (MHK)
Carpet-maker Mohawk (MHK) broke out of congestion for a 10.9% post-earnings gain and a 200DMA breakout. Even with resistance ahead from the July top, this stock is a buy on the dips down to 200DMA support.
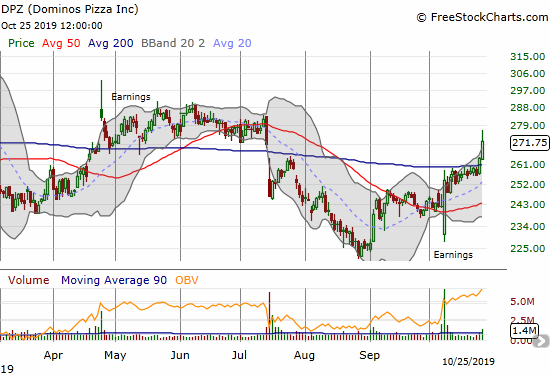
Dominos Pizza (DPZ)
I pointed out Dominos Pizza (DPZ) as a buy on a 200DMA breakout even without confirmation. I pounced as soon as my price alert fired. Friday’s subsequent 3.1% surge seemed to validate the trade. If I were still bearish, I would have sold into the breakout. Now I will just wait to see whether DPZ can push through the next hurdle presented by the congestion from April to July.
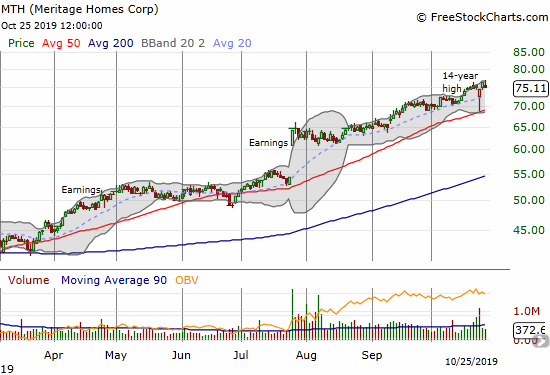
Meritage Homes (MTH)
Meritage Homes (MTH) just keeps trickling higher. The stock survived a jarring post-earnings drop that was over as quickly as it started. The bounce from 50DMA support seems to confirm buyers will keep pushing the stock on up.
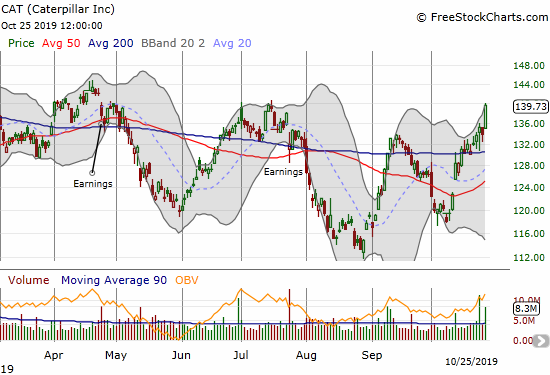
Caterpillar (CAT)
Caterpillar (CAT) lowered its earnings and revenue guidance but the market rewarded the stock with a rebound off 200DMA support. With Friday’s surge, investors and traders are clearly betting that the worst is behind CAT. I bought more puts after earnings thinking CAT would break 200DMA support. I now see little sense to target CAT for put options when the momentum has clearly swung to the upside.
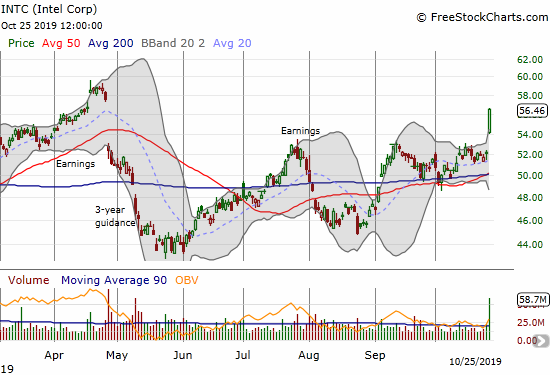
Intel (INTC)
My between earnings buying strategy for Intel (INTC) will be more difficult in the coming cycle. The stock soared 8.1% on Friday in response to earnings. INTC has nearly closed its gap down from April. The stock is now a strong buy on dips absent a close below Friday’s open.
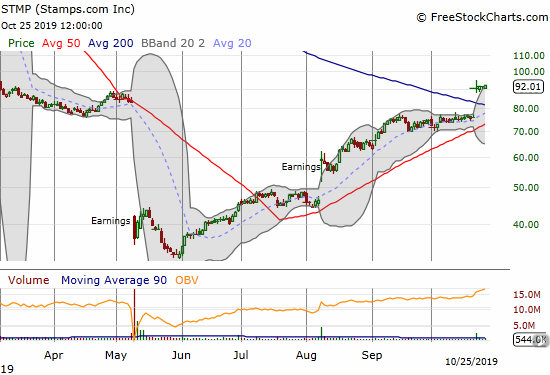
Stamps.com (STMP)
I spent too much time staring and not even time trying to trade Stamps.com (STMP). STMP has made an incredible recovery from May’s disaster, a disaster which made me assume the stock and the company were “finished.” It took five months for STMP to recover. Technically, the August post-earnings gap up was the sign that confirmed the sustainability of the recovery. Now, STMP is a buy on the dips given the post-earnings 200DMA breakout.
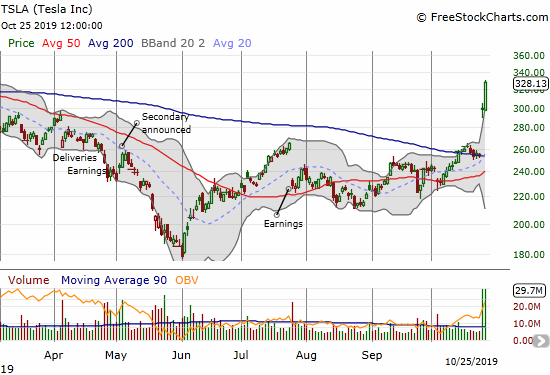
Tesla (TSLA)
Over two months ago, I updated my trading strategies for Tesla (TSLA). That was 100 points ago; TSLA now trades well beyond the range the options market priced in at that time of my post. I was supposed to buy a calendar call spread upon a reversal of the 50DMA breakdown, but I failed to do so. I also should have figured out a long trade once TSLA made broke out above its 200DMA, a move which also completed a reversal of the July gap down.
Those mistakes of omission were bad enough. However, when TSLA soared post-earnings, I decided to get “cute” and short the stock for a quick reversal back to its lower BB or even into the gap up. I also bought a calendar call spread to play a presumed resumption of the upward momentum in the coming week. Friday’s surge caught me completely flat-footed. My calendar call spread hit its profit target, but I did not close the short position alongside that profit. Instead, I bought a $320/$330 call spread expiring in two weeks…once again, I completely under-estimated the sheer power of the new buying interest (short-covering?). I will be fortunate if TSLA just slows down and consolidates around current levels in order to maximize the gains from the calendar spread. Needless to say, I need a fresh reset on my TSLA trading strategy. Stay tuned for another dedicated post on this topic.
— – —
FOLLOW Dr. Duru’s commentary on financial markets via email, StockTwits, Twitter, and even Instagram!
“Above the 40” uses the percentage of stocks trading above their respective 40-day moving averages (DMAs) to assess the technical health of the stock market and to identify extremes in market sentiment that are likely to reverse. Abbreviated as AT40, Above the 40 is an alternative label for “T2108” which was created by Worden. Learn more about T2108 on my T2108 Resource Page. AT200, or T2107, measures the percentage of stocks trading above their respective 200DMAs.
Active AT40 (T2108) periods: Day #198 over 20%, Day #37 over 30%, Day #12 over 40%, Day #9 over 50% (overperiod), Day #2 under 60%, Day #25 under 70%
Daily AT40 (T2108)
")
Black line: AT40 (T2108) (% measured on the right)
Red line: Overbought threshold (70%); Blue line: Oversold threshold (20%)
Weekly AT40 (T2108)

*All charts created using FreeStockCharts unless otherwise stated
The T2108 charts above are my LATEST updates independent of the date of this given AT40 post. For my latest AT40 post click here.
Be careful out there!
Full disclosure: long VIXY calls, long TWTR, long AMZN put, long BYND calendar put spread, long CAT puts, long DPZ, short TSLA shares and long calendar spread
*Charting notes: FreeStockCharts stock prices are not adjusted for dividends. TradingView.com charts for currencies use Tokyo time as the start of the forex trading day. FreeStockCharts currency charts are based on Eastern U.S. time to define the trading day.