
AT40 = 39.0% of stocks are trading above their respective 40-day moving averages (DMAs) (intraday low at 34.5%)
AT200 = 45.3% of stocks are trading above their respective 200DMAs
VIX = 20.6
Short-term Trading Call: cautiously bearish (caveats below)
Stock Market Commentary
A Broad-Based Exit
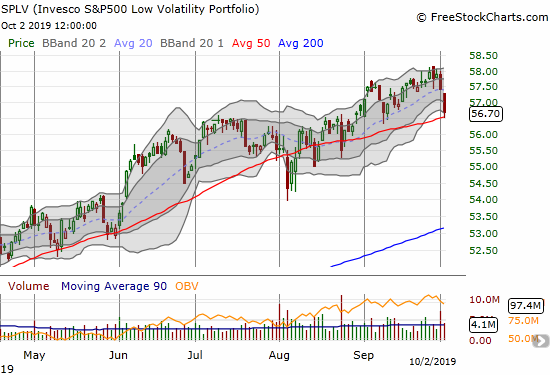
The selling today was so broad that even Invesco S&P 500 Low Volatility ETF (SPLV) fell 1.2%.
The S&P 500 (SPY) started the month with a 1.2% sell-off that took it 1/3 of the way toward the average maximum drawdown for October. Today, the S&P 500 finished that journey with an additional 1.8% pullback right to the target point I noted in my last Above the 40 post. The index is once again in the middle of an obvious trading range.
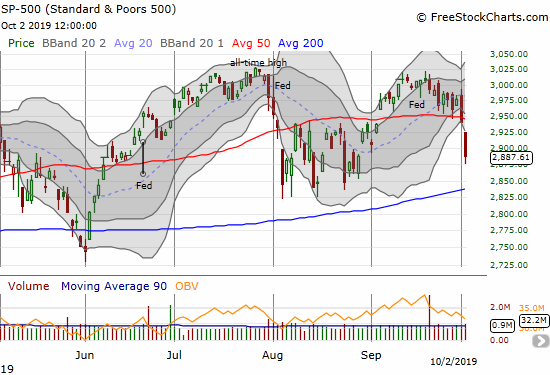
This loss is a bearish move, but it also looks over-extended given the close well below the lower Bollinger Band (BB). I took profits on my S&P 500 puts exactly because of the high odds for a relief bounce from this level. I also took profits in a whole host of bearish positions and even did some nibbling on the buy side (more on that below).
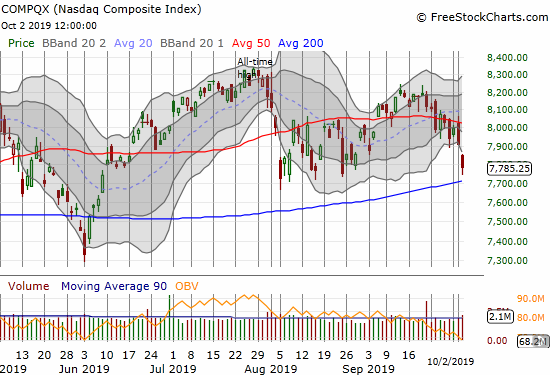
The NASDAQ (COMPQX) lost 1.6%. The tech-laden index gapped down to an open below its lower-BB and did not look back until it approached 200DMA support. I am guessing a real test is all but certain.
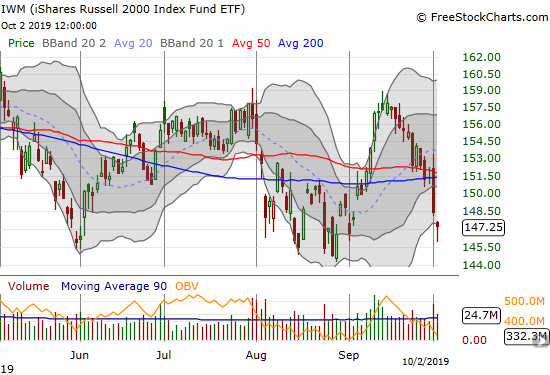
The iShares Russell 2000 Index Fund ETF (IWM) looks like it already got dressed for a relief rally. Buyers stepped in below the lower-BB and returned the index of small caps close to where it opened for trading. The resulting hammer is a classic bottoming pattern, but it needs confirmation with a higher close. The first upside target is obviously a test of converged 50 and 200DMA resistance.
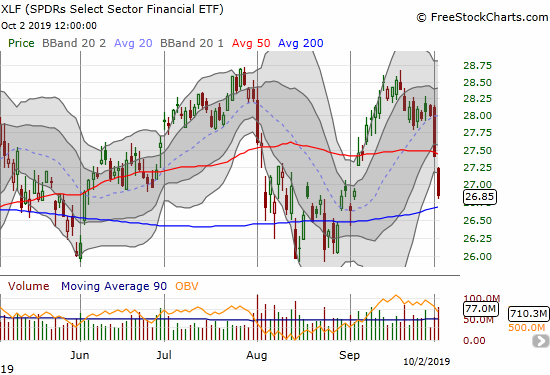
Maintaining the theme, the 2.0% loss for the SPDRS Select Sector Financial ETF (XLF) closed this index of financials below its lower-BB. While a relief bounce looks imminent a test of 200DMA support looks imminent as well.
AT40 (T2108), the percentage of stocks trading above their respective 40-day moving averages (DMAs), summarized the broad-based nature of the selling. My favorite technical indicator fell from 51.3% to as low as 34.5% before closing at 39.0%. As I often say, in a bull market an AT40 in the mid to low 30s is typically “close enough” to oversold to begin buying. Still, I am maintaining my cautiously bearish short-term trading call until I see how this return to the obvious trading range ultimately plays out.
Volatility
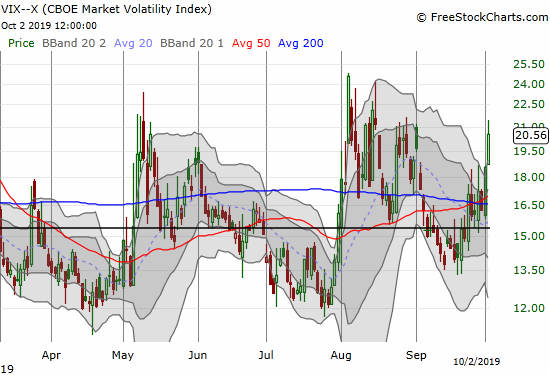
The volatility index (VIX) finally crossed the 20 threshold which is conventionally considered “elevated” volatility. Of course, the volatility faders perk up at this point because selling risk premiums becomes a lot more lucrative. The last two up-cycles alone for the VIX demonstrate the difficulty of keeping fear elevated for long. Accordingly, I took profits on all my VIXY call options. I am not sure yet what conditions would next motivate me to buy a fresh tranche of VIXY call options.
And Now the Wait
With the S&P 500 banished back to its obvious trading range, the time for bold moves is gone. Playing bounces from the boundaries of this range may still be rewarding as bears and bulls push and pull and tug on catalyzing headlines. The next breakout above the range should make me flip all the way to cautiously bullish as the next breakout should be sustainable (that is, sellers should be thoroughly exhausted by then). A breakdown below the range will prime me to plan for buying oversold conditions if AT40 is not already below 20% by then. In between these extremes, I will wait in cautiously bearish mode.
Perhaps all we need next is to hear that trade talks with China are still “constructive.”
Stock Chart Reviews – Bearish
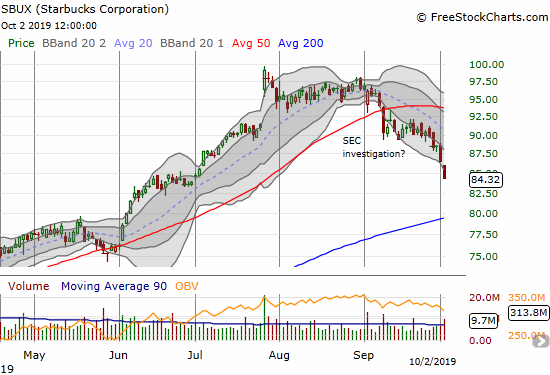
Starbucks (SBUX)
The sell-off this week has finally delivered a convincing follow-through to the bearish 50DMA breakdown I identified last month for Starbucks (SBUX). I took profits on the put options I bought after that post.
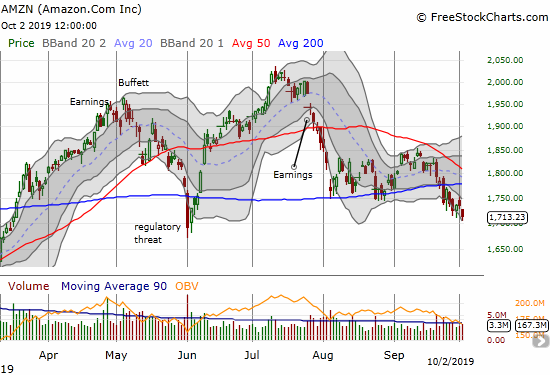
Amazon.com (AMZN)
The moves in Amazon.com (AMZN) are not dramatic but still meaningful. The stock is creeping ever so slowly but surely toward a test of the June low.
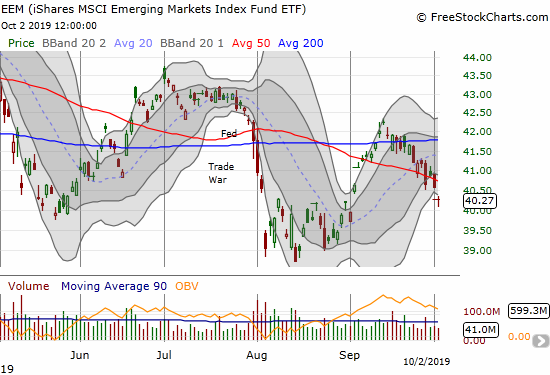
iShares MSCI Emerging Markets Index Fund ETF (EEM)
The iShares MSCI Emerging Markets Index Fund ETF (EEM) confirmed a 50DMA breakdown. I sold a second tranche of puts in EEM on Tuesday. I am still holding the monthly October puts I bought in August. Time is clearly running out for those…
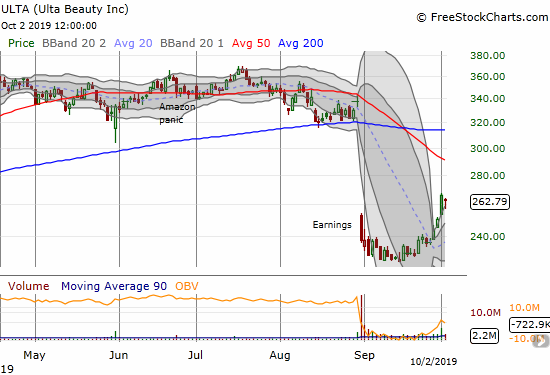
Ulta Beauty (ULTA)
Ulta Beauty (ULTA) has printed an impressive rebound from its post-earnings low. While the market sold off on Tuesday, ULTA soared 6.1% to a post-earnings high on news of insider buying by a Director. I did not catch any of this move, and I think it is “too late” to buy. The stock is still bearish; I fully expect the declining 50DMA to offer stiff resistance. With hindsight, I can see THREE prior signals for buying ULTA for a relief rally: 1) the jump in stock price after ULTA’s daily price range had narrowed to near nothing, 2) the next big up day which confirmed buying interest, 3) Monday’s breakout to resolve a BB squeeze to the upside. Another lesson learned.
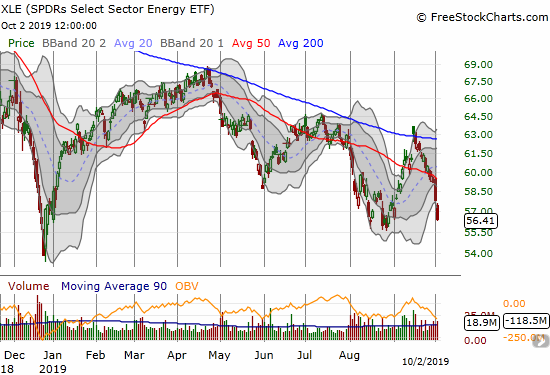
SPDRS Select Energy ETF (XLE)
I have yet to pull the trigger on buying SPDRS Select Energy ETF (XLE). The selling of course intensified this week. Now I want to see a test of the August low and/or a complete reversal of today’s loss before I buy.
Stock Chart Reviews – Bullish
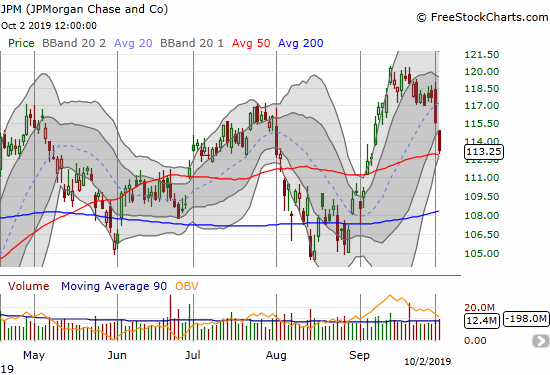
JPMorgan Chase and Co (JPM)
With XLF selling off, I checked on one of its strongest members: JPMorgan Chase and Co (JPM). A few weeks ago JPM broke out to an all-time high. Today, JPM ever so subtly tapped on 50DMA support. I want to buy about a point above today’s close with a tight stop below 50DMA support. Of course if JPM breaks down first, then a test of 200DMA support comes into play.
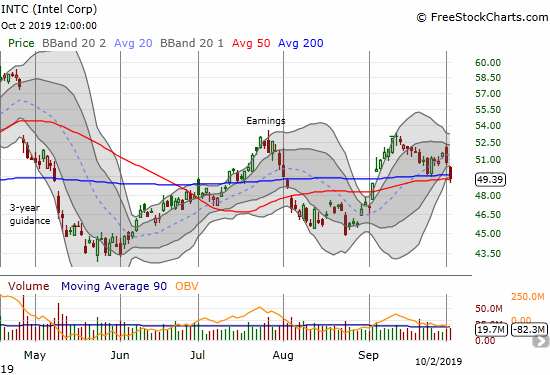
Intel (INTC)
Intel (INTC) fell back to now converged 50 and 200DMA supports. This move gave me one more chance to buy into a between earnings play, and I took it. I bought monthly INTC calls which expire just ahead of earnings on October 24th.
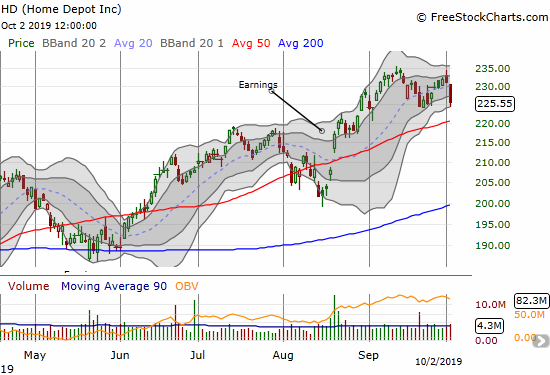
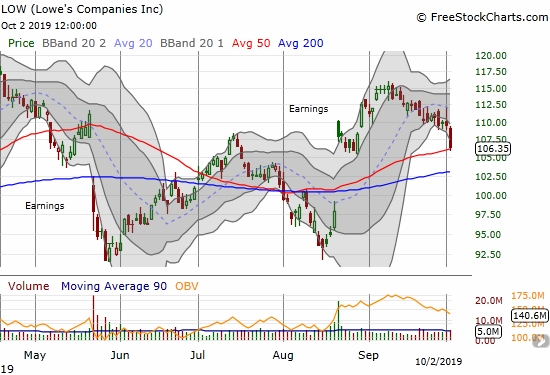
Home Depot (HD) and Lowe’s Companies (LOW)
Three weeks ago, I made the case for a pairs trade going long Home Depot (HD) and short Lowe’s Companies (LOW). I started with a LOW put spread. HD obliged next by falling enough to make a call spread worthwhile. HD is still well within a bullish mode trading above its uptrending 50DMA support and testing the previous low. LOW ran smack into its 50DMA and my $106 downside target which coincides with its post-earnings lows. LOW is now positioned for a bounce, so I will have to take profits soon on my LOW put spread. I will next see whether I can get the double bonus of gains from the HD call spread.
— – —
FOLLOW Dr. Duru’s commentary on financial markets via email, StockTwits, Twitter, and even Instagram!
“Above the 40” uses the percentage of stocks trading above their respective 40-day moving averages (DMAs) to assess the technical health of the stock market and to identify extremes in market sentiment that are likely to reverse. Abbreviated as AT40, Above the 40 is an alternative label for “T2108” which was created by Worden. Learn more about T2108 on my T2108 Resource Page. AT200, or T2107, measures the percentage of stocks trading above their respective 200DMAs.
Active AT40 (T2108) periods: Day #181 over 20%, Day #20 over 30% (overperiod), Day #1 under 40% (underperiod ending 31 days over 40%), Day #1 under 50% (underperiod ending 15 days over 50%), Day #2 under 60%, Day #8 under 70%
Daily AT40 (T2108)
")
Black line: AT40 (T2108) (% measured on the right)
Red line: Overbought threshold (70%); Blue line: Oversold threshold (20%)
Weekly AT40 (T2108)

*All charts created using FreeStockCharts unless otherwise stated
The T2108 charts above are my LATEST updates independent of the date of this given AT40 post. For my latest AT40 post click here.
Be careful out there!
Full disclosure: long HD call spread, long LOW put spread, long EEM puts
*Charting notes: FreeStockCharts stock prices are not adjusted for dividends. TradingView.com charts for currencies use Tokyo time as the start of the forex trading day. FreeStockCharts currency charts are based on Eastern U.S. time to define the trading day.