Realtors Rebound Despite Housing’s Supply Shortage

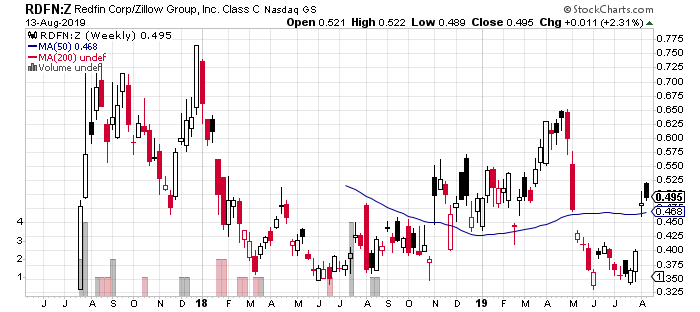
I heard this tweet referenced twice in the financial media: the first time unsourced and the second time sourced. I must assume that the bizarre data points of the U.S. housing market from Glenn Kelman, Redfin’s CEO, went viral. Redfin’s commentary and observations on the housing market are typically astute and insightful, but this particular … Read more

Animal Spirits in Housing Stocks Trampled by Virus Panic – Housing Market Review (February, 2020)

The iShares Dow Jones US Home Construction Index Fund ETF (ITB) dropped 13.4% in a week but managed to bounce off its 200DMA support.

Housing Market Intro/Summary The short-term outlook for the housing market is clouded by the current global turmoil generated by the coronavirus. The housing data discussed below were all collected before the virus came to the forefront of the minds of Americans. While demand for housing in the U.S. should remain strong (and certainly times like … Read more

Housing Market Review (December, 2019) – A Precarious Divergence

Housing Market Intro/Summary When I wrote the Housing Market Review for November, the stocks of home builders were on the edge of conquering their moment of truth. The iShares US Home Construction (ITB) soon rolled over and confirmed a breakdown below support at its 50-day moving average (DMA). ITB is now in a precarious position where … Read more

Real Estate Pairs Trade Refresh: Long Redfin, Short Zillow Group

The ratio of Redfin (RDFN) vs Zillow Group (Z) (ZG) is bouncing off its well-supported historic lows.

My last pairs trade going long Redfin (RDFN) calls versus long Zillow Group (Z) (ZG) put options did not work out as I over-extended my stay on RDFN. A fresh opportunity for a pairs trade has arrived with RDFN neatly testing key support after reversing most of its post-earnings gains and with Zillow Group in … Read more

A Manic Stock Market Leaves Behind An Extreme August Drawdown – Above the 40 (August 9, 2019)

Much ado about nothing? The 15-minute chart of the S&P 500 (SPY) shows the gory details of a manic swoon to a near flat close for the week.

AT40 = 37.3% of stocks are trading above their respective 40-day moving averages (DMAs) AT200 = 46.5% of stocks are trading above their respective 200DMAs VIX = 18.0Short-term Trading Call: neutral (caveats below!) Stock Market Commentary The S&P 500 (SPY) ended the week almost where it started. In between the bookends, the market gyrated wildly … Read more