
AT40 = 37.3% of stocks are trading above their respective 40-day moving averages (DMAs)
AT200 = 46.5% of stocks are trading above their respective 200DMAs
VIX = 18.0
Short-term Trading Call: neutral (caveats below!)
Stock Market Commentary
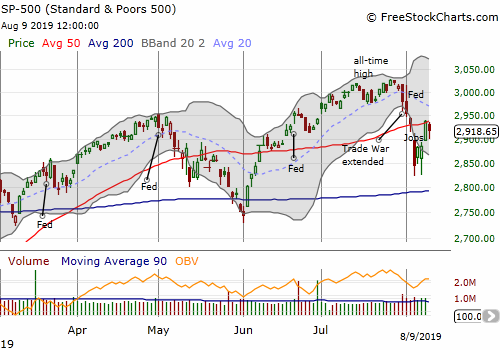
The S&P 500 (SPY) ended the week almost where it started. In between the bookends, the market gyrated wildly from one Trade War headline to the next. While the index still ended the week below resistance at its 50-day moving average (DMA), the market’s overall resilience is yet one more testament to the persistence of the buyers and their determination to look past all manner of bad news and negative catalysts.
A Blow-By-Blow Of A Manic Stock Market
CNBC’s Jim Cramer delivered a great display of the market’s manic swing in emotions.
Before the market open on Tuesday, Cramer (astutely) called out the extremes in Monday’s after hours trading as being overdone. If these trades happened during regular market hours, I could have written about buying an oversold market instead of cautiously nibbling on an almost oversold market.
Despite the extremes, Cramer did not recommend buying. Instead, he focused on the sub-optimal selling behavior.
“Now, again, I am going to tell you that the sellers will be joyous if/when the market comes down to their levels where they panicked. They will say “see, I told you so.” But you need to remember where they COULD have sold. Right here.”
Cramer even implored his audience not to get “sucked in” as the market gapped higher on Tuesday leaving Monday’s night’s sellers stock with some serious remorse. I was able to properly interpret this tweet because Cramer warned his audience on Mad Money the previous evening not to chase buyers higher or rush into buying the market.
Sellers quickly closed the opening gap as they rushed to take advantage of the better prices; the process took just one hour. The dip provided a Cramer-approved buying opportunity. Not only did the market bottom soon afterward, but it also rallied to close higher than the opening gap!
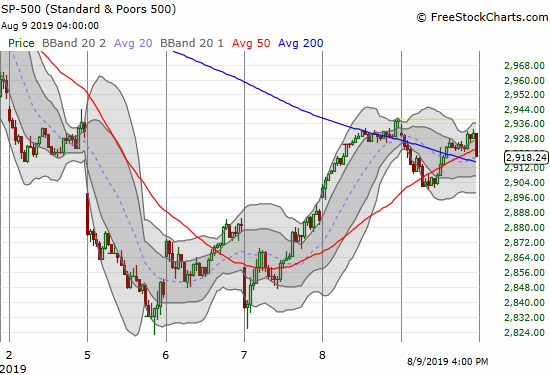
The next day, Wednesday, the stock market gapped down again (the daily chart above does not show the correct open). Within 30 minutes, the S&P 500 (SPY) essentially tested the intraday low from Monday. Cramer was steadfast.
After buyers rushed in again, they did not look back until Friday’s weak open. With a gap up on Thursday, and the S&P 500 (SPY) closing slightly above its 50DMA, Cramer essentially declared the “all clear” for the stock market during his Mad Monday show.
I am FAR from declaring an all clear for the stock market: my short-term trading call sits firmly at neutral. The market is at a juncture where I am not convinced the buyers have strength until they demonstrate the ability to punch AT40 (T2108), the percentage of stocks trading above their respective 40DMAs, into overbought territory (above 70%). Until then, rallies will continue failing at or around all-time highs.
Volatility Surge and Implosion
After the volatility index (VIX) surged close to 25 on Monday, the faders went to work. Even as intraday swings took hold in the stock market, the daily trend for the VIX was a steady implosion. Only Friday’s small pullback in the stock market delivered another positive close for the VIX.
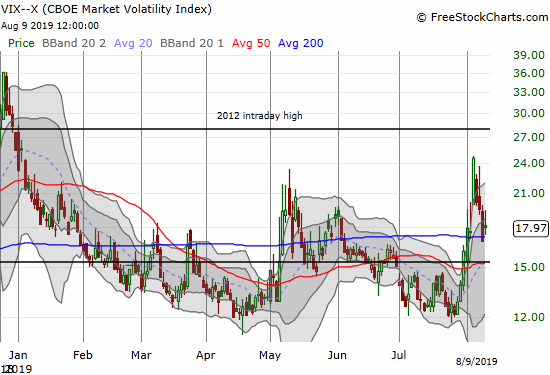
Last May’s behavior provides an example of how/when the VIX can throw off one more gasp before resuming its implosion back to complacency. The big wildcard is the seasonal weakness in the stock market. The maximum closing drawdown for the S&P 500 (SPY) so far in August is 4.6%. This drawdown is far higher than the average or median drawdowns (3.2% and 2.2% respectively) for the S&P 500’s most dangerous month. In fact, since 1951, the S&P 500 has only experienced 17 (25%) other Augusts with worse maximum drawdowns. The odds favor the August lows holding for the rest of the month. More churn ahead…
A Looming Warning?
Expecting the August lows to hold is NOT a bullish call.
In my last Above the 40 post, I used the monthly chart of the S&P 500 (SPY) to suggest a major top is looming in the stock market. Assuming the index will make a run toward all-time highs in coming weeks, I am looking to AT40 to help me get a good entry on fading the stock market during this dangerous August to September period. AT40 topped out just under overbought conditions ahead of the last three sell-offs or pullbacks with the last two providing the biggest bear opportunities. The list below uses the first transition from the 60% overperiod into the 60% underperiod as a definition for confirming a rejection from the overbought threshold (70%).
- March 19: AT40 fell from 64.0% to 59.8%. The S&P 500 maximized its subsequent drawdown in 4 trading days at 1.2%
- April 9: AT40 fell from 66.4% to 58.4%. The S&P 500 maximized its subsequent drawdown on June 3rd at 4.6% AFTER the index first maximized a subsequent gain on April 30 at 2.3%.
- July 19: AT40 fell from 61.5% to 58.5%. The S&P 500 maximized its subsequent drawdown on August 5th at 4.4% AFTER the index first maximized a subsequent gain on July 26 at 1.7%.
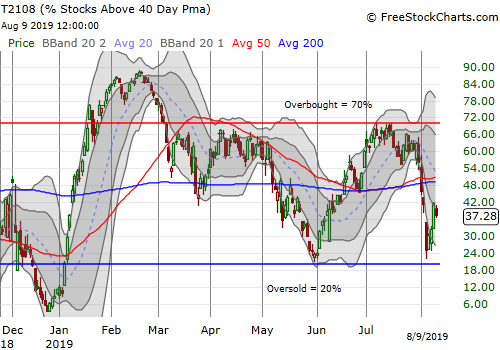
Note how the market’s resiliency opened only brief windows of selling which themselves tested the resolve of shorts. I did not short the market off the last overbought failure because I was too cautious ahead of the Federal Reserve. Now it is clear to me that trade and global economic news is big enough to overwhelm anything the Fed has to say or do in the short-term. The market once again expects aggressive cuts from the Fed, so there is little the Fed can do to deliver an upside surprise.
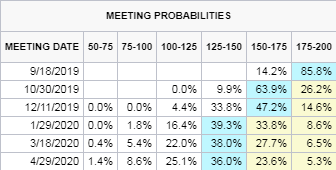
Source: CME FedWatch Tool
The next Fed announcement on monetary policy is September 18th. My top scenario consists of a rejection from the overbought threshold just ahead of the meeting or soon after. I will once again look to get long volatility going into the September Fed meeting and will get particularly aggressive if the market is back to complacent levels on the VIX (below 15).
Stock Chart Reviews – Bearish
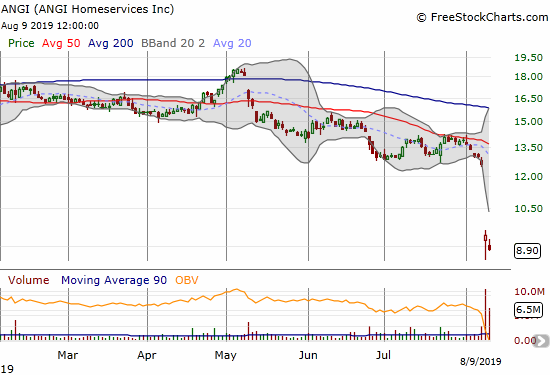
ANGI Homeservices (ANGI)
ANGI Homeservices (ANGI) dropped 25.4% post-earnings. ANGI actually traded even lower not long ago. I assume the major reason for the drop is a significant cut in 2019 guidace. According to Briefing.com, ANGI cut expectations for 2019’s operating income from $105-125M to $30-60M. As Friday’s additional 5.4% loss suggests, it will take some time for investors to adjust to the significant deterioration in performance.
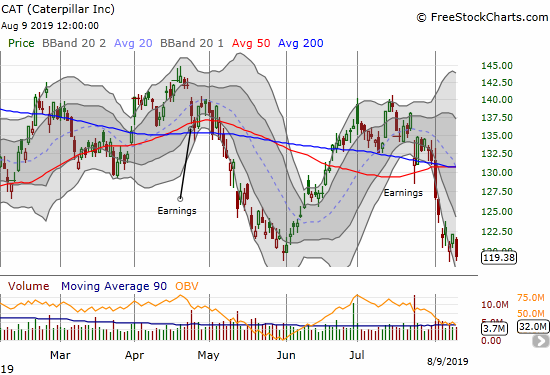
Caterpillar (CAT)
Caterpillar (CAT) continued its post-earnings weakness. The stock market’s rebound barely helped alleviate the gravitational pull on the stock. CAT ended the week at a new closing low. I took profits on CAT puts the previous week and of course regretted bailing so early. I opened up new positions and got more aggressive: $117 weekly puts expiring this coming Friday and a September $115/$110 put spread.
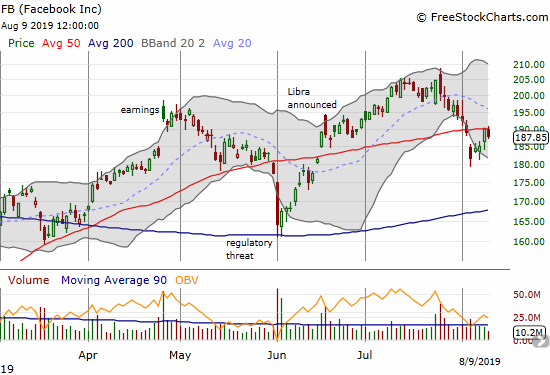
Facebook (FB)
Facebook (FB) failed right at 50DMA resistance, but I would not short the stock until resistance gets confirmed with follow-through selling. I would turn right around and buy on a (confirmed) 50DMA breakout with a $205 or so upside target.
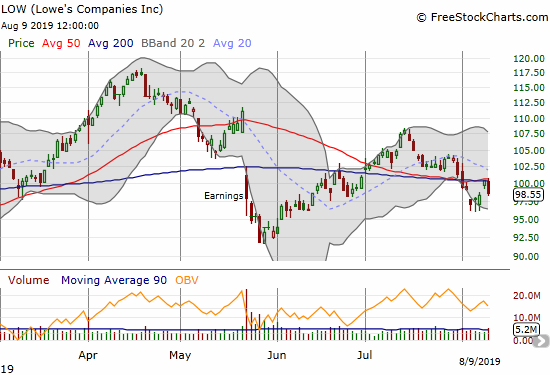
Lowe’s Companies (LOW)
I should have taken profits on the 50/200DMA breakout for Lowe’s Companies (LOW), but I thought LOW was playing catch-up to Home Depot (HD). The fresh breakdown is untimely as my call options expire this coming Friday.
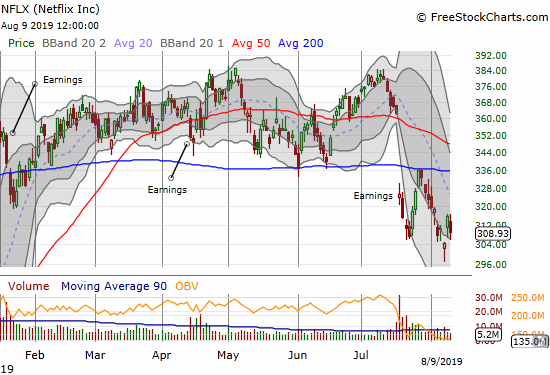
Netflix (NFLX)
Netflix (NFLX) by far looks the worst of the FANG (Facebook, Amazon.com, Netflix, and Google/Alphabet) stocks. NFLX confirmed 200DMA resistance and last week’s sell-off took the stock to 7-month lows at one point. NFLX also did not bottom until Wednesday. At the lows of that day, my put spread looked very good. At the end of the day, I realized I let greed get ahead of me as I stared at a bottoming hammer pattern. Friday’s pullback bailed me out, and I was able to salvage a small profit.
I am now treating NFLX the same way I treat CAT when I sense potential danger. I plan to maintain some kind of bearish position in the stock as long as the technicals make sense. After closing out the put spread, I opened a calendar put spread at the $300 strike. The short end expires this Friday and the long end is a September monthly put. Until/unless the spread hits a profit target, I plan to keep selling a weekly $300 put against the long September $300 put.
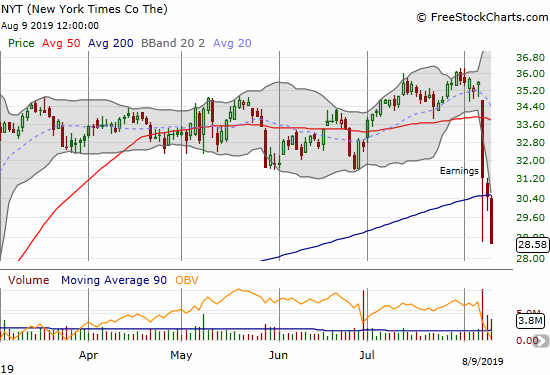
New York Times (NYT)
The New York Times (NYT) soared 55% in the first 2 1/2 months of 2019 and then stopped cold. Last week’s post-earnings breakdown looks severe and looks like the beginning of a more extended pullback. If NYT manages to recover its 200DMA as support, I want to be a buyer.
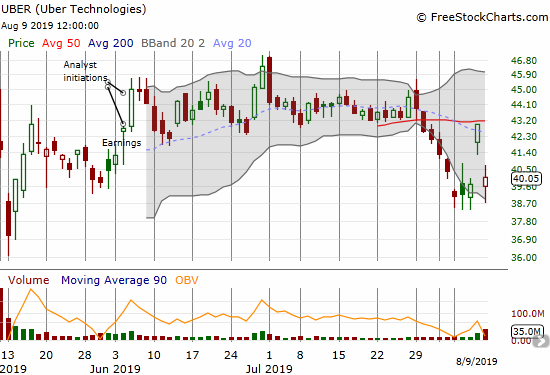
Uber (UBER)
I ran out of time to post my pre-earnings assessment of Uber (UBER) like I did ahead of the company’s first earnings report. This time around, UBER provided quite a spectacle. The stock soared 8.2% ahead of earnings in sympathy with the market’s positive response to earnings from Lyft (LYFT). However, Lyft spent the day fading from its gap open, so I did not understand the UBER surge. It looked like a classic situation to fade, so I shorted shares.
Just in case I missed something big, I looked for a way to hedge my position. I was immediately struck by the slim gap in price between weekly call options expiring last Friday and the following Friday at the $45 strike. I immediately loaded up a large calendar call spread position given the low risk, high upside potential of the trade. In after hours, UBER dropped right back to the recent low, and I covered there. I was surprised UBER managed to bounce as high as $41 to finish after hours trading. I was not able to short shares again, but I did so during regular hours at $40.10. With an abandoned baby top in place, I expect UBER to soon resume the downtrend that preceded earnings.
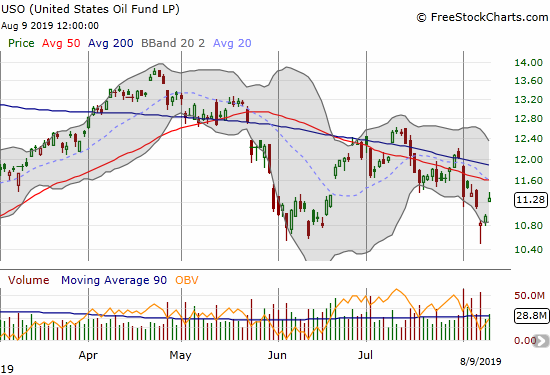
United States Oil Fund (USO)
I loaded up on call options on the United States Oil Fund (USO) as a bet on a rally back to resistance. After USO gapped up for a 3%+ gain the very next day, I had to take my near 50% profits….especially ahead of a weekend. In the meantime, USO is still in an overall bearish position given the declining 50 and 200DMAs.
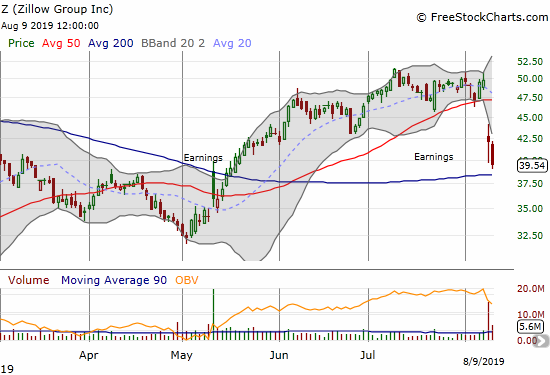
Zillow Group (Z) (ZG)
I remain a skeptic of Zillow’s foray into real estate brokerage. The rally and resilience going into earnings last week caught me by surprise. It even lulled me to sleep enough not to try a bearish bet on earnings. While Zillow (Z) (ZG) held 200DMA support, I put the stock in the bearish bucket given the 50DMA breakdown and my abiding skepticism.
Stock Chart Reviews – Bullish
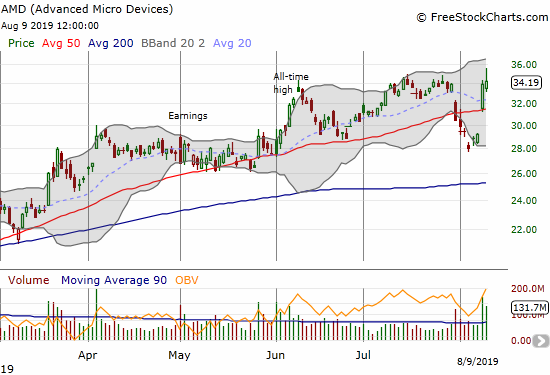
Advanced Micro Devices (AMD)
Hard to believe I was ever bearish on Advanced Micro Devices (AMD)! Product news surely caught bears flat-footed as the stock was languishing after a 50DMA breakdown. The stock’s fade on Friday makes me a bit suspicious, but clearly AMD remains a stock to buy on dips.
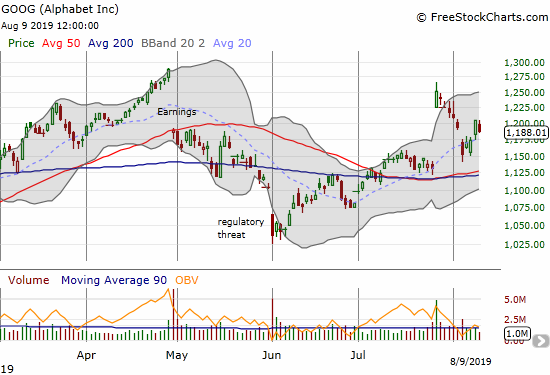
Alphabet (GOOG)
Alphabet (GOOG) almost filled its post-earnings gap up and gave me a fresh opportunity to buy. It took two swings before I hit a homerun. Given GOOG has no exposure to China, I am particularly keen to buy Trade War related dips in the stock. My first swing at GOOG was a calendar call spread at the $1250 strike with the long end expiring this Friday. I am just riding it in case the market surprises to the upside this week.
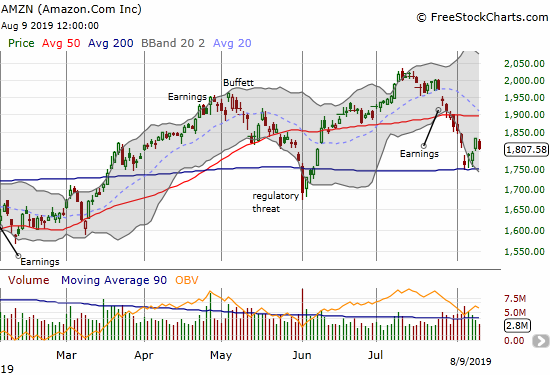
Amazon.com (AMZN)
Amazon.com (AMZN) gave enough confirmation of a successful test of 200DMA support the next day as the general market bounced away from the oversold threshold. I quickly put in place a calendar call spread at the $1850 strike. I fully expected the short side to expire and give me a full runway for the coming week. Instead, the implosion of volatility that accompanied the market’s rally took down the short side enough to drive the calendar spread into my profit target. Along with GOOG, AMZN is at the top of my buy list for the coming week if conditions warrant buying.
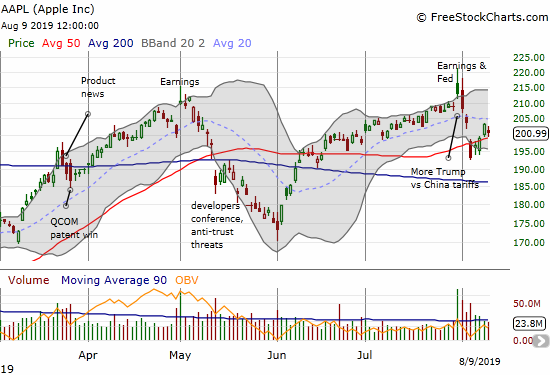
Apple (AAPL)
Apple (AAPL) managed to recover enough to print a 50DMA breakout. I remain bullish on AAPL and my weekly call buying strategy is back in full swing. I sold my last tranche of calls into Thursday’s breakout. I still have my pre-earnings $210/215 call spread in play, so I am fine quickly flipping other call options. (I am currently wondering whether to make an “odd couple” out of Apple and Caterpillar with a pairs trade).
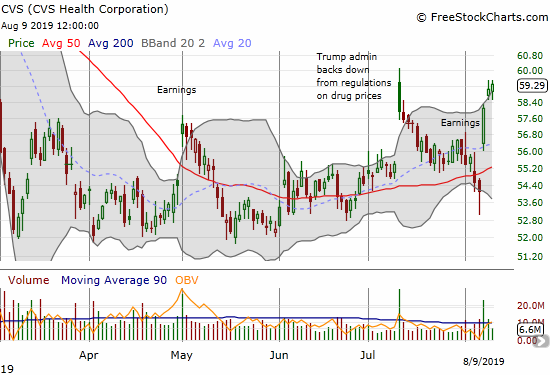
CVS Health Corporation (CVS)
I put CVS Health Corporation (CVS) in the bullish camp after it nearly reversed all its gains from positive regulatory news. The market sell-off last week helped push the stock through 50DMA support. Earnings quickly reversed the breakdown and placed the stock near a 6-month high.
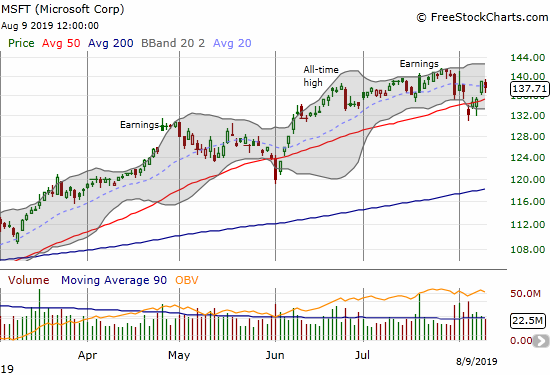
Microsoft (MSFT)
Microsoft (MSFT) is like Apple (AAPL) except its uptrend is healthier. Like AAPL, I am focused on buying any dips the stock presents.
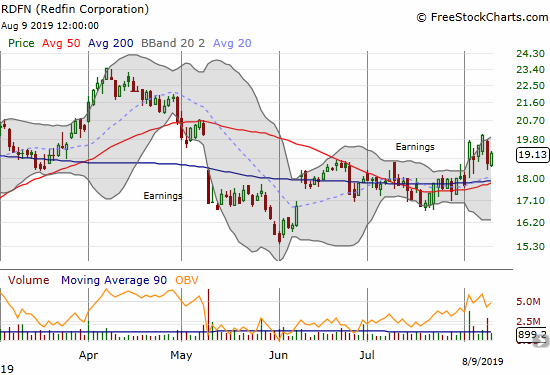
Redfin (RDFN)
I have not yet reviewed the earnings for Redfin (RDFN). Still, given the stock slid so readily in sympathy with Zillow’s decline, I suspect I will find more reasons to scratch my head at the company’s business model.
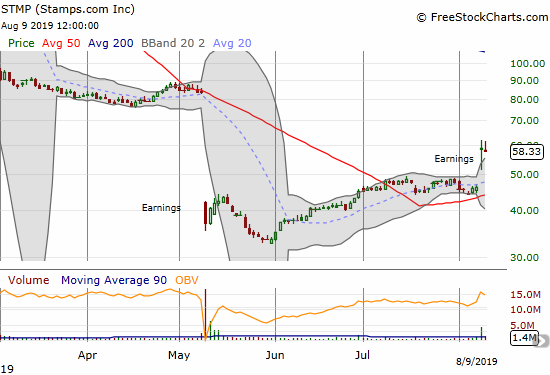
Stamps.com (STMP)
I thought the May post-earnings plunge was the final death knell for Stamps.com (STMP). A new post-earnings low by the end of the month seemed to confirm the bearishness. Yet the stock printed an impressive post-earnings recovery for the next month and a half before momentum ended. Last week’s post-earnings surge seems to confirm a recovery is truly underway. I will have to review the earnings!
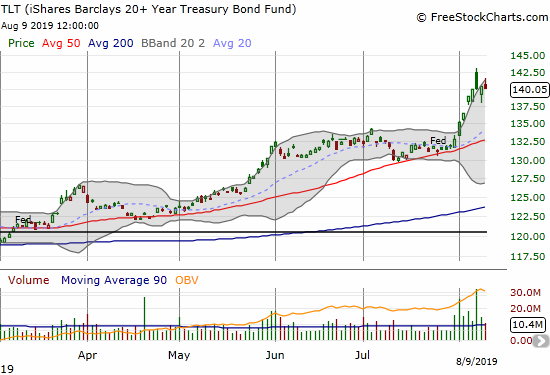
iShares Barclays 20+ Year Treasury Bond Fund (TLT)
The iShares Barclays 20+ Year Treasury Bond Fund (TLT) had a gap and crap on Wednesday. If I did not already have puts in place, I may have thought to swing yet again as TLT was over-extended above its upper Bollinger Band (BB). The window was brief though as TLT looks like it is already stabilizing.
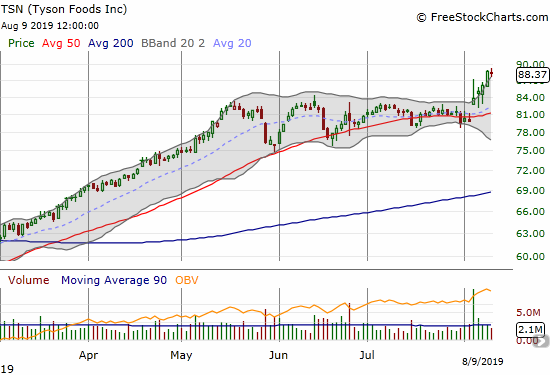
Tyson Foods (TSN)
In mid-June, Tyson Foods (TSN) announced plans to launch later this year alternative protein products. The stock continued to build a wedge pattern with 50DMA support. Earnings last week sent the stock to a bullish breakout from that pattern and to new all-time highs. TSN is a buy on the dips.
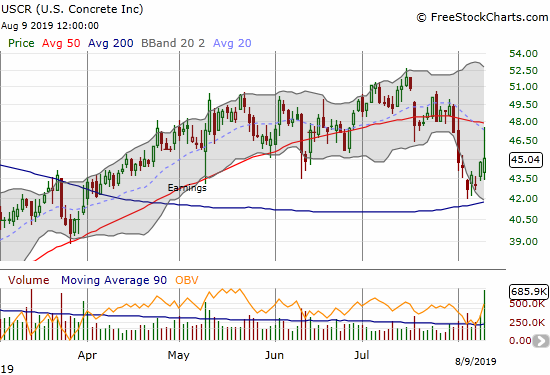
U.S. Concrete (USCR)
U.S. Concrete (USCR) announced earnings that initially were sold at Friday’s open. Buyers stepped in and almost tapped 50DMA resistance. I have not yet reviewed earnings, but I am currently expecting 200DMA support to hold. The nascent decline in the 50DMA is a bit concerning though.
— – —
FOLLOW Dr. Duru’s commentary on financial markets via email, StockTwits, Twitter, and even Instagram!
“Above the 40” uses the percentage of stocks trading above their respective 40-day moving averages (DMAs) to assess the technical health of the stock market and to identify extremes in market sentiment that are likely to reverse. Abbreviated as AT40, Above the 40 is an alternative label for “T2108” which was created by Worden. Learn more about T2108 on my T2108 Resource Page. AT200, or T2107, measures the percentage of stocks trading above their respective 200DMAs.
Active AT40 (T2108) periods: Day #150 over 20%, Day #5 over 30% (overperiod), Day #1 under 40% (underperiod ending 1 day over 40%), Day #8 under 50%, Day #17 under 60%, Day #107 under 70%
Daily AT40 (T2108)
")
Black line: AT40 (T2108) (% measured on the right)
Red line: Overbought threshold (70%); Blue line: Oversold threshold (20%)
Weekly AT40 (T2108)

*All charts created using FreeStockCharts unless otherwise stated
The T2108 charts above are my LATEST updates independent of the date of this given AT40 post. For my latest AT40 post click here.
Be careful out there!
Full disclosure: long long TLT puts, long UVXY put, long UVXY calls, long AAPL calls, call spread and puts, short UBER shares and long calls, long GOOG call, long LOW call, long USCR, short LYFT puts and long calls, long NFLX calendar put spread
*Charting notes: FreeStockCharts stock prices are not adjusted for dividends. TradingView.com charts for currencies use Tokyo time as the start of the forex trading day. FreeStockCharts currency charts are based on Eastern U.S. time to define the trading day.