
Housing Market Intro/Summary
When I wrote the Housing Market Review for November, the stocks of home builders were on the edge of conquering their moment of truth. The iShares US Home Construction (ITB) soon rolled over and confirmed a breakdown below support at its 50-day moving average (DMA). ITB is now in a precarious position where it has failed to recover from the 50DMA breakdown for five trading days even as the S&P 500 (SPY) keeps hitting fresh all-time highs. The confirmation of the 50DMA breakdown forced me to finally take profits on my January $40/44 call spread.
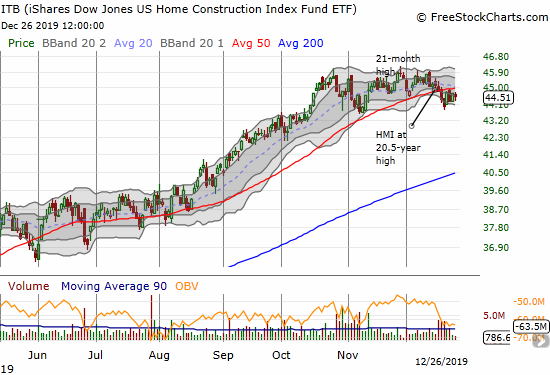
The near record-setting Housing Market Index (HMI) further accentuates the precarious bearish divergence between the S&P 500 and home builders. December’s HMI signifies a soaring optimism and enthusiasm among home builders that was last seen in 1999! None of the other housing data even comes close to supporting the relative level of the HMI. Indeed, the stocks of most home builders suggest a waning enthusiasm in the stock market for home builders.
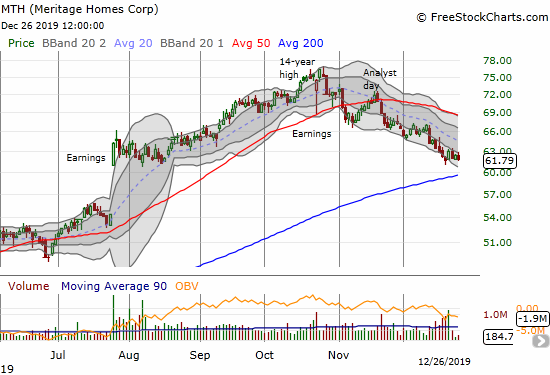
Meritage Homes (MTH) remains at the top of my list of concern. MTH has now reversed all its incremental gains from July earnings and is close to challenging its uptrending 200DMA. MTH has lost about 17% since setting a 14-year high in October.
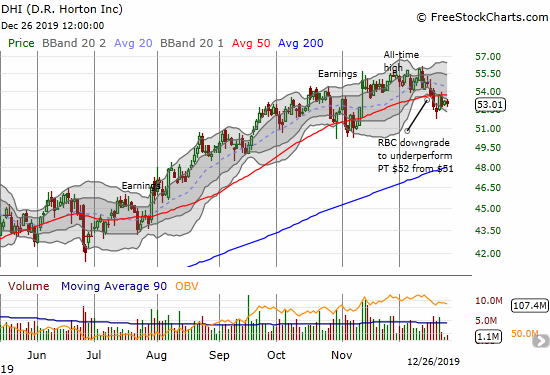
D.R. Horton (DHI) is one of the best performing builders as it managed to hit an all-time high earlier this month. Still, DHI has now reversed all its gains from earnings last month and is struggling to recover from a 50DMA breakdown. I suspect a buyback program is the main driver propping up the stock.
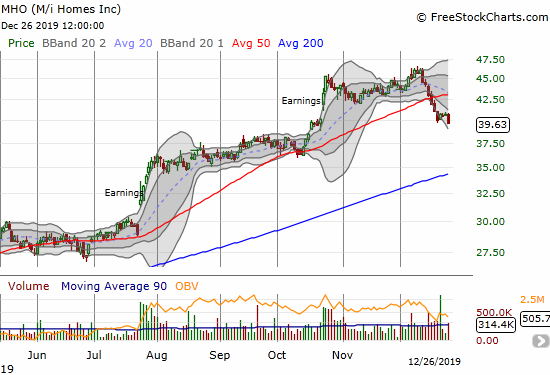
M/I Homes (MHO) has suffered high-volume selling this month. The 50DMA breakdown and reversal of all its post-earnings gains suggest the stock has topped out for some time to come. However, unlike other teetering builders, MHO still enjoys significant gains from the July breakout. MHO even has two breakouts since the summer and the second one still holds residual gains.
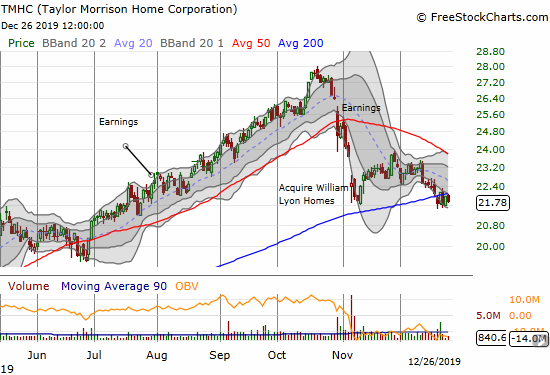
When I wrote about Taylor Morrison Home Corporation (TMHC), I lamented that its deal to buy William Lyon Homes (WLH) was poorly timed. Last week, TMHC broke below its 200DMA support and is at a post-deal low. I am even less interested in buying back into TMHC than before.
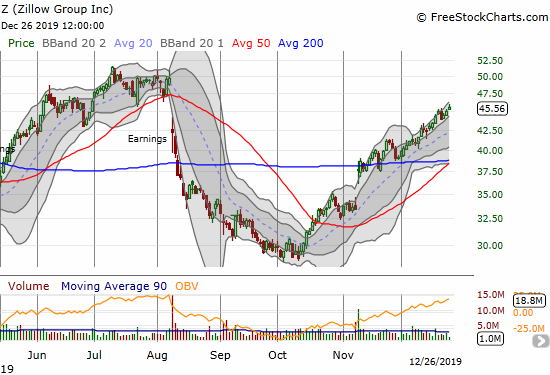
Zillow Group (Z) is on the recovery trail. Unlike the stocks of home builders, Zillow Group is rallying. This stock, and Redfin (RDFN), is a key main stock telling me there is yet hope for the home builders to deliver on the promise of the seasonally strong period for these stocks.
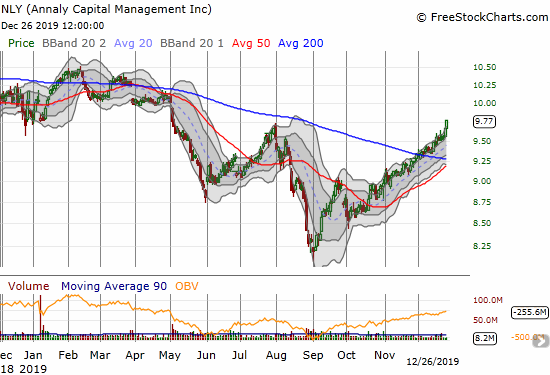
Mortgaged-based financial companies like Annaly Capital Management (NLY) have been on a tear since August/September lows. The end of rate cuts from the Federal Reserve seems to be serving them well. I also look at the recovery in stocks like NLY as potential reasons to expect home builders to turn around sooner than later.
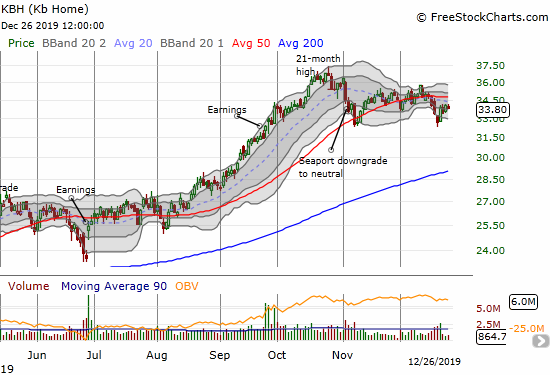
During this period when the stocks of home builders look like they are rolling over, KB Home (KBH) is the only stock I have dared toaccumulate. After the stock appeared to hold support from the November low, I added to existing call options that I bought when I thought KBH was going to hold support at its 50DMA.
I find it ironic that home builders first appeared to race ahead of the housing data earlier this year. After the data caught up with the stocks, the stocks now look like they are rolling over – essentially confirming my earlier suspicion that traders and investors were front-running the launch of the 2019/2020 seasonally strong period. For now, the ratio between SPY and ITB is near the middle of a range mostly in place since 2012. Still, this apparently benign placement belies the stark and precarious contrast between an S&P 500 (SPY) hitting multiple all-time highs and an ITB which topped out exactly at its January, 2017 climactic high.
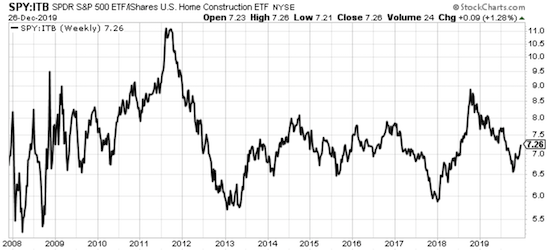
Source: StockCharts.com
New Residential Construction (Single-Family Housing Starts) – November, 2019
While builder sentiment soars (see further below), housing starts continue a slow and measured ascent toward the post-recession high set January, 2019.
Single-family housing starts for October were revised downward from 936,000 to 916,000. November starts increased month-over-month by 3.2% to 938,000. On an annual basis, single-family housing starts increased by a solid 13.6%. For perspective, recall that from October, 2018 to May, 2019, the year-over-year percentage changes were negative except for January’s 9.4% gain. The last six months delivered year-over-year gains as the housing market recovered from last year’s slowdown. The big question remains whether builders will continue to pick up the pace.
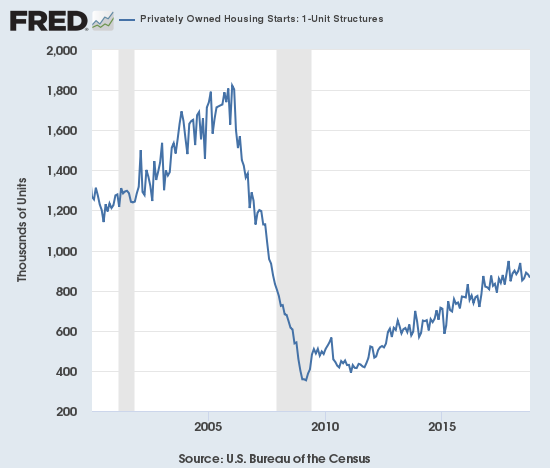
Source: US. Bureau of the Census, Privately Owned Housing Starts: 1-Unit Structures [HOUST1F], retrieved from FRED, Federal Reserve Bank of St. Louis, December 25, 2019.
On a regional basis, the year-over-year changes were extreme and widely distributed for October. For November, the regional changes were consistent. The Northeast in particular returned to gains: the region pulled back 5 of the last 6 months with October delivering a whopping 43.1% year-over-year loss. The Northeast, Midwest, South, and West each changed +9.6%, 0.0%, +7.9%, and +5.9% respectively. The furious construction activity in the South continues to lead the way in consistency.
Existing Home Sales – November, 2019
The 16-month streak of year-over-year declines for existing home sales came to an end, just barely, in July. I recently turned my (wary) attention to anticipating a breakout to new post-recession highs. November’s decline suggests such a breakout is not on the horizon. For the fourth straight year, existing home sales will remain locked in a definitive range.
The seasonally adjusted annualized sales in November of 5.35M were down 1.7% month-over-month from the slightly downward revised 5.44M in sales for October (from 5.46M). Year-over-year sales increased 2.7%. August remains the highest point for existing home sales in 2019.

(As of the March, 2018 data, the NAR further reduced historical data to just 13 months. For historical data from 1999 to 2014, click here. For historical data from 2014 to 2018, click here) Source for chart: National Association of Realtors, Existing Home Sales© [EXHOSLUSM495S], retrieved from FRED, Federal Reserve Bank of St. Louis, December 26, 2019.

The National Association of Realtors (NAR) talked optimistically in the previous report about rising sales assuming “adequate” inventories. With sales down for the month, the NAR decided to put a positive spin on the situation.
“Sales will be choppy when inventory levels are low, but the economy is otherwise performing very well with more than 2 million job gains in the past year.”
The NAR did return to lamenting about limited inventories. This time the NAR included some fresh advice for home builders.
“The new home construction seems to be coming to the market, but we are still not seeing the amount of construction needed to solve the housing shortage…It is time for builders to be innovative and creative, possibly incorporating more factory-made modules to make houses affordable rather than building homes all on-site.”
Absolute inventory levels of 1.64M homes represented a susbtantial decline of 7.3% from October and down 5.7% year-over-year. Although sales declined for the month, inventory still declined on a month of sales basis: “Unsold inventory sits at a 3.7-month supply at the current sales pace, down from 3.9 months in October and from the 4.0-month figure recorded in November 2018.” The on-going decline in inventory is now at five straight months.
The median price of an existing home hit $271,300, a year-over-year increase of 5.4% and the 93rd straight month of a year-over-year gain. This relentless ascent in price has little changed whether inventories happen to drop or gain in any given month. The median price just barely stopped dropping on a sequential basis: after four straight months of declines, November’s median price scraped out a 0.1% price increase. If a changing mix toward lower-priced homes is driving the recent trend, perhaps by the first half of 2020, the streak of year-over-year gains will finally end; I have been fooled before. However, other data from the existing home sales report suggests that the shift toward more affordable homes has already come to an end. The NAR even provided some direct, supporting data:
“Compared to one year ago, fewer homes were sold below $250,000; with a 16% decline for homes priced below $100,000 and a 4% reduction for homes priced from $100,000 to below $250,000.”
I noted in the previous Housing Market Review that the recent shift toward first-time buyers in the existing home market seemed to have slowed. October’s share dropped to 31% from September’s 33% and was flat year-over-year. November’s share nudged back to 32% but still down from November, 2018’s 33%. The average share for first-time homebuyers for 2016 was 35%. The NAR’s 2017 Profile of Home Buyers and Sellers reported an average of 34% for 2017, 33% for 2018, and 33% for 2019. If a shift is still happening toward more affordable homes, it is not likely coming from first-time buyers.
Investors purchased 16% of homes in November, up from October’s 14%. With sales down for the month, this change is another sign that the shift to lower-end buyers is likely coming to an end.
The highlight for regional sales in August was the end of a 13-month streak of declines for year-over-year sales in the West. Only the Midwest failed to gain in September and only the Northeast failed to gain in October. For November, the Northeast was once again the only region that failed to make gains. Here are the regional changes: Northeast -1.4%, Midwest +1.5%, South +3.7%, West +4.8%.
Like September and October, all regions experienced notable and robust price jumps in October. Here are the regional year-over-year changes in median home prices: Northeast +3.9%, Midwest +5.9%, South +4.8%, West +7.1%.
Single-family sales decreased 1.2% from October and increased on a yearly basis by 3.5%. The median price of $274,000 was up a healthy 5.4% year-over-year, once again higher than the tight 4.5% to 4.7% range from May to August.
California Existing Home Sales – November, 2019
The market for existing homes in California tightened up in November.
The California Association of Realtors (CAR) reported sales of existing Californian homes at a 10-year low in January. July sales were at a 15-month high. Year-over-year sales are now up five months straight. November sales were down 0.3% from October and up 5.6% year-over-year. September’s year-over-year gain of 5.8% was the largest annual gain in 30 months. The San Francisco Bay Area was the only region which failed to gain.
February’s median price was the lowest in 12 months. The median price suddenly swung to record highs from June to August. October’s year-over-year gain was the largest since July, 2018, but November’s 2.6% monthly drop was the first time in 7 months that the median closed below $600,000. The year-over-year change was still a positive 6.4%. The San Francisco Bay Area ended 9 straight months of year-over-year declines in its median price.
In September, the number of active listings dropped 11.8% year-over-year, the largest such drop since December, 2017. October’s 18.0% year-over-year drop was the fourth straight month of declines and the largest since May 2013. November’s decline slipped right past October with a drop of 22.5% and the largest since April, 2013.
This sudden drop in listings is an interesting contrast to the re-emerging concern about an exodus of wage-earners leaving California. California only lost a net 190,000 people last year, but this story gains easy cachet given the high expense of living in the state. Nightly Business Report did a small segment on this “trend” on December 26, 2019 (starting at the 23:25 mark):
New Residential Sales (Single-Family) – November, 2019
In November, the Census Bureau revised September sales of new single-family homes significantly upward from 701,000 to 738,000. The Bureau further revised that number to 730,000. I rarely point out revisions of two months old data, but this revision is significant in that it means the housing market only made a new post-recession high by 1,000 new home sales (June, 2019 was 729,000). October reversed the shine of September with a significant downward revision from 733,000 to 710,000. November’s sales of 719,000 are a 1.3% gain from October’s revised sales and 16.9% above November, 2018 new home sales. The favorable comparables to last year’s sales slowdown are coming to an end and the year-over-year gains seem to be reflecting the end. Here are the last few months of year-over-year gains in new home sales: August +17.2%, September +20.3%, October +27.4%.
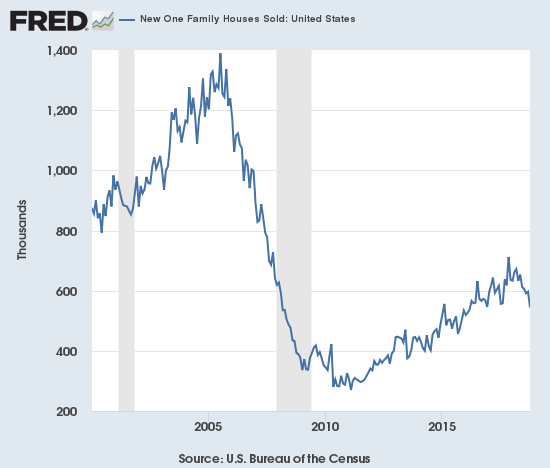
Source: US. Bureau of the Census, New One Family Houses Sold: United States [HSN1F], retrieved from FRED, Federal Reserve Bank of St. Louis, December 26, 2019.
Since hitting a post-recession peak in November and December, 2017, the median price of a new single-family home has trended slightly downward to stalled out largely thanks to a surge in entry-level and lower-priced new homes. However, just as with existing home sales, new home sales may no longer benefit from such a shift. September’s median price was adjusted up further from $310,200 to $312,100. October’s median was $316,900, and November hit $330,800, the second highest level for the year and a a strong 7.2% jump from the previous year.
October’s slight shift toward more expensive homes accelerated in November. ALL the price tiers above $300,000 increased their share of sales. The $400,000 to $499,000 range increased the most on a percentage point basis from 11% to 15%. The $200,000 to $299,999 range experienced all the losses of the lower tiers with a plunge in share from 36% to 30%.
Ever since the inventory of new homes for sale jumped to 6.0 months of sales in June, 2018, inventory has pivoted around that 6.0 level. June 2019’s inventory sat at 6.3 days of sales. July increased ever so slightly to 6.4. However, sales in August were high enough to send inventory plunging back to 5.5 days of sales where they stayed for September. November’s inventory dropped to 5.3 days of sales from October’s 5.4 days of sales. It looks like the new pivot is below 6.0.
The regional changes in sales were mixed with a dramatic surge in the West that could help explain the shifts in pricing. November sales in the Northeast increased 6.7%, the Midwest dropped 1.4%, the South gained 9.0% (after surging 40.6% in October), and the West soared 47.9 % (after a 21.9% gain in October). The West is now closing in on its post-recession high set two years ago.
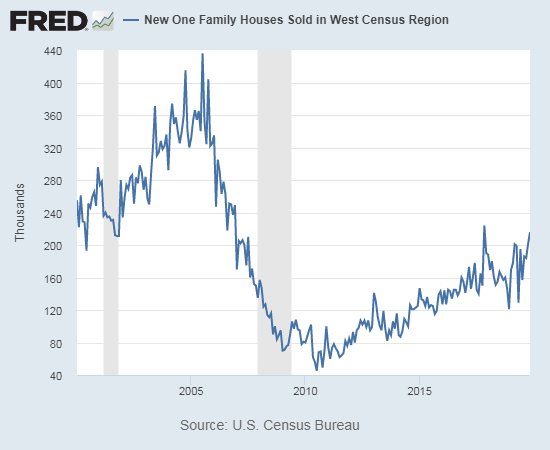
Source: US. Bureau of the Census, New One Family Houses Sold in West Census Region [HSN1FW], retrieved from FRED, Federal Reserve Bank of St. Louis, December 26, 2019.
Home Builder Confidence: The Housing Market Index – December, 2019
If not for my standardized formatting for this Housing Market Review, I would have started this post with the Housing Market Index (HMI). At 76, the HMI soared to an amazing 20 1/2 year high. Since the National Association of Home Builders (NAHB) started calculating the HMI in 1985, there are only THREE readings at least as high as that hit in December: November, 1998 at 77, December, 1998 at 78, and June, 1999 at 77. In November, the Housing Market Index (revised) tied its 20-month high from October at 71. December’s sudden jump of 7.0% is the highest one-month change since a 7.2% gain two years ago.
Despite these major milestones, the NAHB barely commented on the startling news:
“Builders are continuing to see the housing rebound that began in the spring, supported by a low supply of existing homes, low mortgage rates and a strong labor market. While we are seeing near-term positive market conditions with a 50-year low for the unemployment rate and increased wage growth, we are still underbuilding due to supply-side constraints like labor and land availability. Higher development costs are hurting affordability and dampening more robust construction growth.”
In other words, the NAHB continues to lament how much better things could be if the market did not suffer so many constraints. Indeed, it is quite a contrast to see the HMI near record levels and yet new home sales remain well off their peak from the last housing bubble. Moreover, housing starts are struggling to set a new post-recession high which is itself about 44% below the peak activity from the housing bubble. So while the HMI looks quite stretched and overly exuberant, the context for these heights is much different than in previous cycles. It seems builders have effectively normalized much lower levels of building and sales activity.
December’s HMI was led by the Single Family Detached Present component, a reminder of how current conditions greatly influence the HMI. At 84, this component is at its third highest level ever. The Single Family Detached Next Six Months has been higher than this month’s 79 level 12 other times. The Traffic of Prospective Buyers, the slowest and most “reluctant” of the components, has been higher than this month’s 58 6 other times.
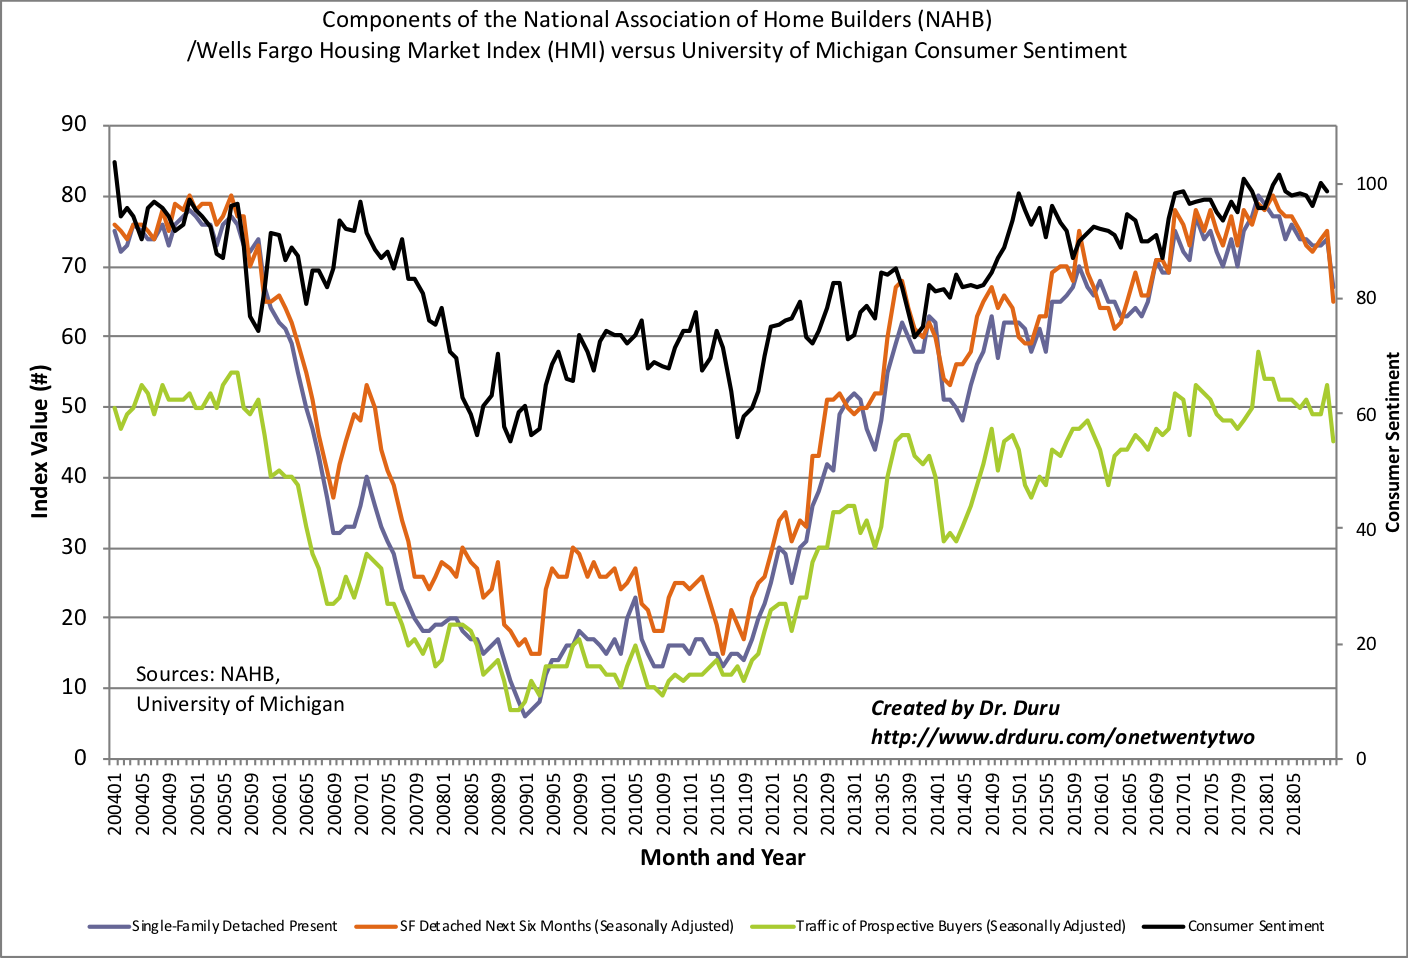
Source: NAHB
The regional HMI results were a bit of a head-scratcher for October and November. I thought the behavior was a potential indicator of an unfolding topping process in HMI. December was even more of a head-scratcher, but now I think of the divergence in regions as potential fodder for an even higher HMI rather than a top. The Northeast was the worst performer with a drop from 64 to 58, a 4-month low. The West pulled back a bit from 85 to 83, a return to October’s level. The South has been a leading region for sentiment, but its HMI only increased from 75 to 77. The Midwest was the true set of fireworks with a surge from 58 to 73. This is a 2-year high for the Midwest after it was just struggling to make any progress for almost half the year.
Parting thoughts
The Revitalization of American Cities
On December 26th, Marketplace broadcast an interesting interview with A.K. Sandoval-Strausz the author of “Barrio America: How Latino Immigrants Saved the American City.” The interview is a different look at the revitalization of American cities that is typically attributed to gentrification by young, affluent, mostly white collar workers.
Be careful out there!
Full disclosure: long NLY, long KBH calls