
A Manic Stock Market Leaves Behind An Extreme August Drawdown – Above the 40 (August 9, 2019)
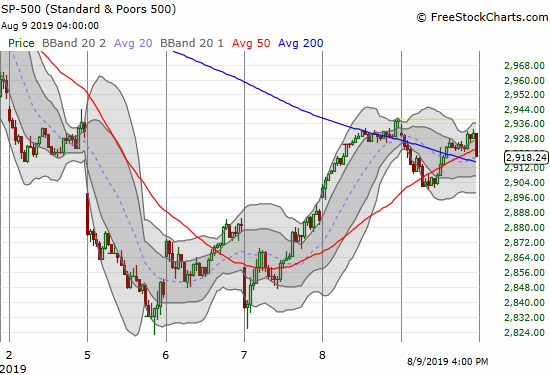
AT40 = 37.3% of stocks are trading above their respective 40-day moving averages (DMAs) AT200 = 46.5% of stocks are trading above their respective 200DMAs VIX = 18.0Short-term Trading Call: neutral (caveats below!) Stock Market Commentary The S&P 500 (SPY) ended the week almost where it started. In between the bookends, the market gyrated wildly … Read more