
Housing Market Intro/Summary
The short-term outlook for the housing market is clouded by the current global turmoil generated by the coronavirus. The housing data discussed below were all collected before the virus came to the forefront of the minds of Americans. While demand for housing in the U.S. should remain strong (and certainly times like these remind people of the importance of owning your own square of peace), the cost of building a home will likely increase. Yahoo Finance pointed out the following:
“The biggest threat to inventory would be to homebuilders’ supply chains. About 30% of building products imported to the U.S. come from China, including both residential and nonresidential construction, according to Richard Branch, chief economist for Dodge Data & Analytics, which tracks the construction industry. The products include wallboard, lighting, and other materials. Branch said in an email that China is the largest single supplier of building products to the U.S., Canada, and Mexico follow supplying about 20% each. “
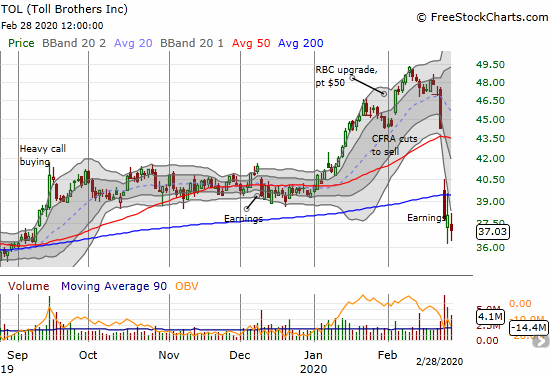
Given the price-sensitivity of the home shoppers who are dominating the current market, higher material costs will pressure the margins of builders. They will not be able to pass along much of their higher costs into the price of homes. Fears of such cost increases may have helped drop Toll Brothers (TOL) 14.6% after it reported earnings last week. Moreover, demand may decline from Chinese buyers of the luxury homes that Toll Brothers builds.
From the Seeking Alpha transcript of Toll Brothers’ conference call (edited for clarity):
“So, we believe 11 closings in California, have been pushed out, we think, and we hope to the second quarter due to the virus that’s the intelligence we’re receiving from our sales teams out in California. We are much smaller in Orange County right now than we were three years ago and Orange County has been where most of the Chinese buyers have, at least for the Toll Brothers have purchased. We don’t see nearly as many. We have foreign buyers throughout California, but the Chinese buyers were really concentrated in Orange County. We see very few in Northern Cal or in LA County or Northern San Diego County, where we also operate.
With respect to the supply side, the only interruption that we’re feeling right now is lighting, which is coming directly out of California and some of the small appliances, where either components or the full appliance are being manufactured in China. Longer-term, there’s some chatter about whether steel will become an issue, but we’re not feeling that yet.
…if there’s any one product that was to be hit, lighting would probably be the least impactful, because worst case you can always get a house lit up with temporary lights and make it through a little while until the chandelier and the sconce arrives.
Based on the commentary from Toll Brothers, the net impact of coronavirus fears should be small, but large enough for investors to stay away from the stock. The commentary on Chinese buyers is a bit circular as one can assume that the reason TOL is shrinking in Orange County is specifically because of the withdrawal of Chinese buyers from the market for luxury homes in the U.S. (California). I do not consider TOL’s sell-off to be a buying opportunity as part of the seasonal trade on home builders mainly because I have doubts about Toll’s position in a market dominated by the search for affordable, lower-priced homes.
When I wrote the Housing Market Review for January, I described a promising start to the year just a month after noting a “precarious” divergence between the performance of the iShares US Home Construction (ITB) and the S&P 500 (SPY). January delivered such a dramatic turn-around that I was compelled to write “Animal Spirits Rediscover Housing-Related Stocks” with ITB breaking out to a fresh 13-year high…just ahead of a small pullback. That pullback ended right after i published my piece. The current virus and TOL-related sell-off sent ITB sharply down to its 200-day moving average (DMA) and a 4+ month low. ITB is down 2.3% year-to-date versus the 8.6% loss in the S&P 500 (SPY). I fully expect the performance advantage for ITB to persist through the rest of the seasonal period.
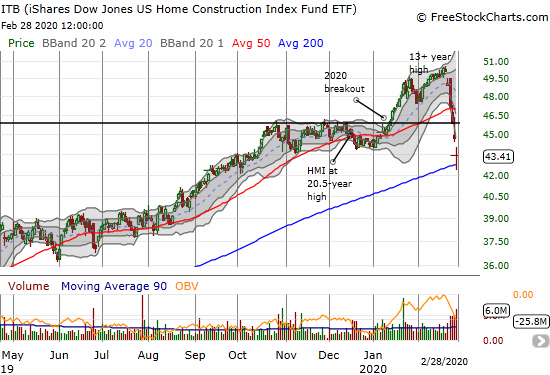
While I left TOL alone, I did make trades according to my seasonal strategy. I added to my ITB April call options and also bought shares. I will focus on ITB shares going forward given the expense of options with volatility so high.
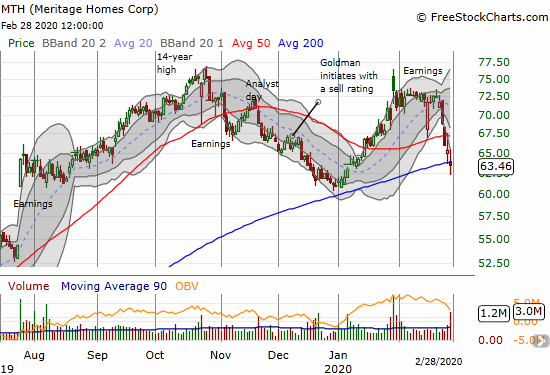
I just finished reading the transcript of the earnings conference call from Meritage Homes (MTH). I was struck by the increased optimism compared to the “slower growth trajectory” that MTH called out during its analyst day. On Friday, MTH sold down to its 200-day moving average (DMA). Mainly for technical reasons, I sold an April $60 put option to take advantage of the high premiums. The $60 level is also key support, and I do not mind owning the stock at those levels since I expect MTH to be one of the biggest beneficiaries of the next turn-around in the stocks for home builders.
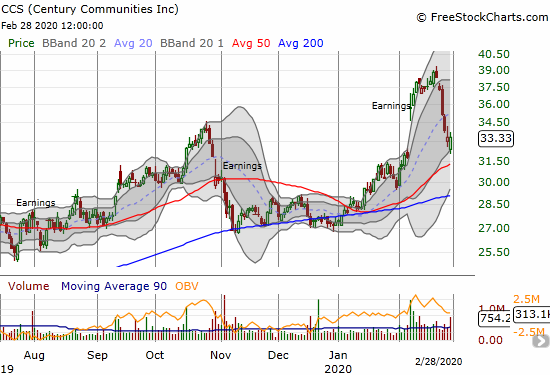
At the beginning of the week I noticed how well Century Communities (CCS) was holding up. I did not think the good fortune could last so I took profits. The trade turned out to be timely. I bought right back into CCS on Friday as the stock closed in on a complete reversal of its post-earnings gap up. CCS is another builder whose stock I do not mind holding beyond the seasonal period.
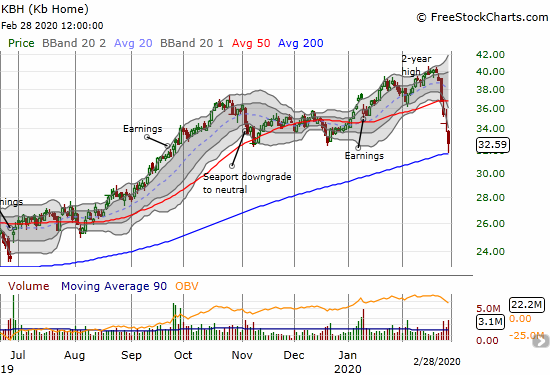
KB Home (KBH) sliced through its 50DMA and tested its 200DMA on Friday. This move took KBH back to its September earnings. I loaded up on April call options here despite the high premium. I expect KBH to rebound sharply whenever the stock market turns around. My sell target is 50DMA resistance (over 10% higher from Friday’s close).
The trades I made last week exhausted my shopping list of home builders for now. I want to see how oversold conditions in the stock market play out before deciding my next moves. I plan to stick to my seasonal strategy through April and may extend it to May if the market is still offering up builders at bargain prices at that time.
New Residential Construction (Single-Family Housing Starts) – January, 2020
Overall, housing starts remain quite strong relative to the post-recession trend.
Single-family housing starts for November were originally revised upward from 938,000 to 949,000 but now revised back down to 940,000. December starts were revised upward from 1,055,000 to 1,073,000. January starts dropped 5.9% from December’s level. On an annual basis, single-family housing starts increased 4.6%. This gain brings the year-over-year percentage changes back down from two straight months of double-digit gains. The comparables get tougher going forward, and I will be very surprised to see more than one or two double-digit year-over-year gains for the remainder of this year (even without a notable slowdown in global growth trends).
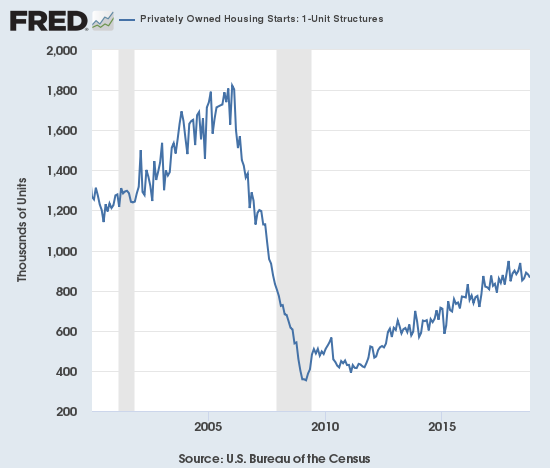
Source: US. Bureau of the Census, Privately Owned Housing Starts: 1-Unit Structures [HOUST1F], retrieved from FRED, Federal Reserve Bank of St. Louis, February 19, 2020.
For January, the regional changes were divergent. The Northeast ended its recent recovery and the West kept up its blistering pace. The Northeast, Midwest, South, and West each changed -15.4%, +17.7%, -3.7%, and +24.7% respectively. The furious construction activity in the South actually took a bit of a rest in January.
Existing Home Sales – January, 2020
The latest report from the National Association of Realtors (NAR) included less of the usual color commentary.
The seasonally adjusted annualized sales in January of 5.46M were down 1.3% month-over-month from the slightly downward revised 5.53M in sales for December. Year-over-year sales increased 9.6% with the easy comparison with the end of the last housing slowdown.

(As of the March, 2018 data, the NAR further reduced historical data to just 13 months. For historical data from 1999 to 2014, click here. For historical data from 2014 to 2018, click here) Source for chart: National Association of Realtors, Existing Home Sales© [EXHOSLUSM495S], retrieved from FRED, Federal Reserve Bank of St. Louis, February 29, 2020.

January delivered another mix of strong sales, reduced inventories, and higher prices. The NAR held back on its usual lamentations and instead (inadvertently?) suggested affordability has improved: “Mortgage rates have helped with affordability, but it is supply conditions that are driving price growth.”
The NAR continues to look forward to 2020 given the upward trend in housing starts: “The trend line for housing starts is increasing and showing steady improvement, which should ultimately lead to more home sales.” I still do not see housing starts becoming a driving force for existing home sales anytime soon given the extreme tightness in the existing home market.
Absolute inventory levels of 1.42M homes actually increased 2.2% from December, but inventory is still down a whopping 10.7% from a year ago. December’s inventory was down 8.5% year-over-year. “Unsold inventory sits at a 3.1-month supply at the current sales pace, up from the 3.0-month figure recorded in December and down from the 3.8-month figure recorded in January 2019.” The on-going year-over-year decline in inventory is now at eight straight months.
The median price of an existing home hit $266,300, a large year-over-year increase of 6.8% and the 95th straight month of a year-over-year gain. However, prices peaked at $285,400 in June, 2019 so once again the prospect draws near for ending this stubborn streak. I am expecting the media jump all over such a price decline as a harbinger of bad market conditions even though the underlying driver may be a preference for lower-priced homes rather than a lack of demand.
In December, the share of first-time buyers dropped to 31% from November’s 32%. In January the share bumped back up to 32%, a notable increase from last January’s 29%. The average share for first-time homebuyers for 2016 was 35%. The NAR’s 2017 Profile of Home Buyers and Sellers reported an average of 34% for 2017, 33% for 2018, and 33% for 2019. This slight downward trend in the share of first-timers means that the shift to more affordable homes in the market for existing homes is led by people downsizing and/or abandoning high-priced markets.
Investors purchased 17% of homes in January and December, up from last year’s January of 16%.
The Northeast failed to make gains in October and November. In December and January all regions made strong year-over-year gains with the easy comparables. The regional changes for January were once again strong across the board: Northeast +7.4%, Midwest +8.4%, South +11.7%, West +8.2%.
Like September through December, all regions experienced notable and robust price jumps in January. Here are the regional year-over-year changes in median home prices: Northeast +11.5%, Midwest +5.4%, South +6.3%, West +5.2%.
Single-family home sales decreased 1.2% from December and increased on a yearly basis by 8.9%. The median price of $268,600 was up a healthy 6.9% year-over-year, but down from December’s $276,900.
California Existing Home Sales – January, 2020
The market for existing homes in California further tightened in January with prices soaring amid strong demand.
The California Association of Realtors (CAR) reported sales of existing Californian homes at a 10-year low in January, 2019, so January, 2020’s year-over-year gain of 10.3% came against an easy comparable. Year-over-year sales are now up seven straight months. January sales were down 0.7% from December.
The median price in California swung to record highs from June to August. January’s median of $575,160 was down 6.5% from December (the largest month-over-month decline in 7 years, partially thanks to a shift in mix toward lower-priced homes) and up 7.1% year-over-year. Recall that according to the CAR the December “year-over-year price increase was the largest since May 2014 and the first double-digit price increase in more than five-and-a-half years.” January delivered the fourth straight month with a year-over-year price increase above 6%.
The inventory situation in California continues to worsen. In September, the number of active listings dropped 11.8% year-over-year, the largest such drop since December, 2017. October’s 18.0% year-over-year was the largest since May 2013. November’s decline of 22.5%, December’s drop of 25.9% (revised), and January’s drop of 26.9% were the largest percentage drops since April, 2013. The unsold inventory index hit 2.5 months of sales in December. The index rebounded a bit to 3.4 months of sales in January but was still down year-over-year from 4.6 months. These inventory extremes in California greatly benefit the home builders scrambling to find ways to get home built in the state.
New Residential Sales (Single-Family) – January, 2020
The revision of sales numbers beyond the previous month finally stabilized a bit. December was revised up from 694,000 to 708,000. January’s estimated sales of 764,000 marked a large jump of 7.9% from December and a 18.6% surge from the previous year’s depressed sales levels. New home sales are now back to a post-recession high and keeping pace with housing starts.
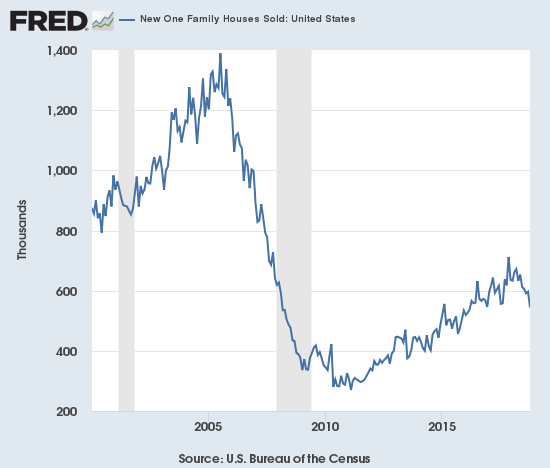
Source: US. Bureau of the Census, New One Family Houses Sold: United States [HSN1F], retrieved from FRED, Federal Reserve Bank of St. Louis, February 29, 2020.
Since hitting a post-recession peak in November and December, 2017, the median price of a new single-family home has trended slightly downward to stalled out largely thanks to a surge in entry-level and lower-priced new homes. In my last Housing Market Review, I concluded “…just as with existing home sales, new home sales may no longer benefit from such a shift.” Sure enough, the median price of a new home surged (and diverged from existing homes) in January to $348,200, a 7.4% jump from December and a 14.0% year-over-year surge. January’s median price was also a new all-time high.
October’s slight shift toward more expensive homes accelerated in November, but the shift was mixed in December. In January, the top three price tiers (above $400,000) were the only tiers to gain share in the distribution of prices. The share of homes priced at least $750K returned to the highs of 2019.
The inventory of new homes remains below the ideal 6.0 months of sales. January inventory fell from December’s 5.7 to 5.1.
The regional changes in sales left the South far behind and likely contributed to the overall shifts in price distribution given the concentration of lower-priced housing in the South. January sales in the Northeast increased 46.7%, the Midwest increased 47.8%, the South slid for a second month this time by 2.4%, and the West surged 49.1%. The recent declines in the South mark a significant cooling from large gains from June through September, 2019. The chart below suggests the South’s new home sales have simply returned to trend after a brief spurt of over-activity.
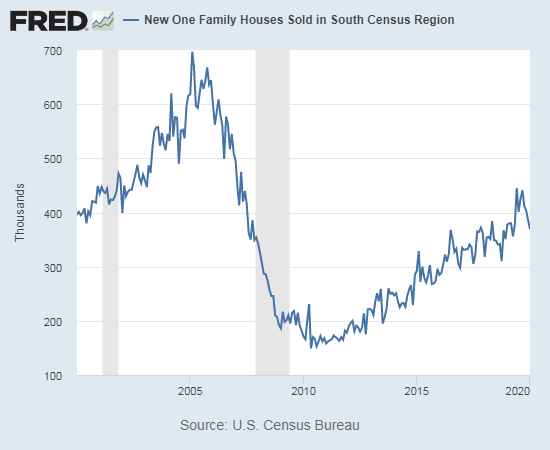
Source: U.S. Census Bureau and U.S. Department of Housing and Urban Development, New One Family Houses Sold in South Census Region [HSN1FS], retrieved from FRED, Federal Reserve Bank of St. Louis, February 29, 2020.
Home Builder Confidence: The Housing Market Index – February, 2020
It’s starting to look like builder confidence has finally peaked for a while. In December, the Housing Market Index (HMI) hit an amazing 20 1/2 year high. For January, the HMI nudged lower from 76 to 75. In February, the HMI fell another point. The National Association of Home Builders (NAHB) chose to emphasize the collectively high level of confidence:
” The last three monthly readings mark the highest sentiment levels since December 2017.”
The NAHB proceeded to identify the drivers of higher home prices: “At a time when demand is on the rise, regulatory constraints along with a shortage of construction workers and a dearth of lots are hindering the production of affordable housing in local communities across the nation…”
Each of the components of HMI declined even as consumer confidence broke out to a new 16-year high (it will likely pull back sharply for February thanks to the virus fears). I suspect the HMI has peaked for a while, especially given past history shows sentiment typically takes frequent rests in the middle of an uptrend.
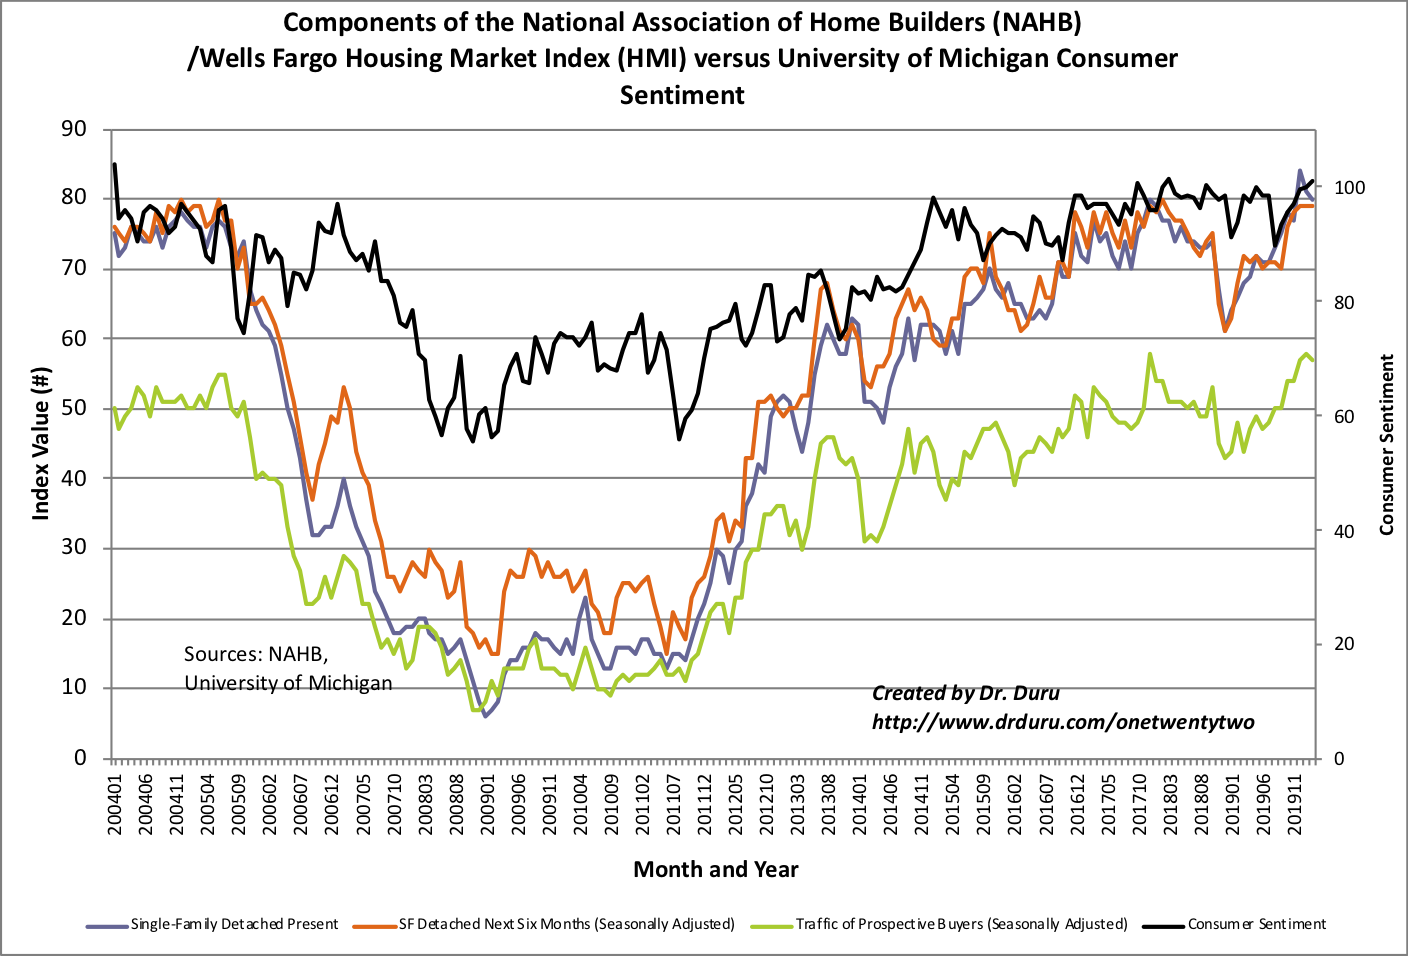
Source: NAHB
On a regional basis, HMI had mixed results. The Midwest declined for a second month. The West also declined from 86 to a still hot 82. The Northeast jumped from 62 to 67, its highest level since 2005. The South hit its highest level since at least 2005.
Parting thoughts
Housing Affordability
Housing affordability is an on-going obstacle across the country for households. Last month, Marketplace broadcast a good piece highlighting the struggles of teachers who cannot afford to live where they teach. I imagine at some point, communities will have to pool resources to create housing options for critical public service workers.
Homebuying 101
Sometimes the solution for affordability is assistance in figuring out how to navigate a brutal housing market. Homebuying 101 is a class for low- and middle-income people who are looking to buy for the first time in the Boston area. Marketplace broadcast a segment on this innovative program. From the show:
“Buying in the city itself has already become ‘almost unattainable for a person of low to moderate, even middle income,’ said Elliot Schmiedl, director of homeownership for the Massachusetts Housing Partnership.
‘Then the number of suburbs that circle Boston that are affordable to this degree is just dwindling. Take Quincy as an example. Quincy used to be a working class community outside of Boston where you could go and find a place, reasonable cost, you could get in and out of the city. That’s not the case anymore. You’ve got to go down to Brockton, you’ve got to go 20 miles south.’
The people struggling to stay in the Boston area fear for their economic stability. They recognize the importance of ownership.
‘I think the most important reason for people to make this shift is the security. I can’t tell you how often I run into people, because of what I do, that are fearful that they’re not going to be able to stay where they are,’ Warren-Cato said. ‘For the majority of the people that I see it’s all about, ‘I want something that nobody can take away from me.’'”
Homelessness
The homeless are the most visible failures of housing affordability.
In his State of the State speech, California Governor Gavin Newsom focused on addressing the problems of the state’s homeless population. From his speech (emphasis mine):
“…as a State, we must do everything we can to ensure no Californian is homeless. We must replace California’s scattershot approach with a coordinated crisis-level response. To meet this moment with the commitment it demands, we will advance a new framework. We will reduce street homelessness quickly and humanely through emergency actions. We will be laser-focused on getting the mentally ill out of tents and into treatment. We will provide stable funding to get sustainable results. We will tackle the underproduction of affordable housing in California. And we will do all of this with real accountability and consequences.
First, we’ve started with emergency actions to do everything we can now, to make an immediate, tangible impact.
After decades of neglect and inadequate responses, we are putting our entire state government on notice to respond with urgency.”
Newsom is being appropriately aspirational. I doubt he will succeed in the way he wants given the cost and complexity of the problem – not to mention the issue of attracting more homeless people to California once programs are successful – but the definite good news here is a focus on increasing housing supply and removing government regulatory barriers.
Newsom outlined a series of initiatives and programs. He ended the speech with a promise to greatly ramp the supply of housing:
“Of course, the fundamental building block of California’s solution has to be more housing. A comprehensive response to our collective failure to build enough of it. When we don’t build housing for people at all income levels, we worsen the homeless crisis. It’s a vicious cycle and we own it. And the only sustainable way out of it is to massively increase housing production. Let’s match our courage on homelessness with courage on housing supply.”
I will know this plan is working when home builders report that they are getting through the permitting process faster and are able to go from empty lots to homes faster than ever. The process will not be easy. Competing forces are at work. In Newsom’s own words:
“Our objectives are clear: to increase density in a way that promotes equity, affordability, and inclusion; to increase certainty that ‘units planned’ become ‘units built’ in a way that respects environmental and labor protections; and to hold local governments accountable for both of these pillars—more density and more certainty.”
Changing the model for buying and selling
Finally, I found an Economist article that described the potential tech-based future for buying and selling homes. The article includes good data on moving and the costs of transacting homes. I found this article interesting because I recently became convinced that related companies Redfin (RDFN) and Zillow Group (ZG) (Z) have viable business models in this space. I am planning to buy RDFN during this market pullback; I hope to hold some shares for multiple years as the property market undergoes what could be a revolution.
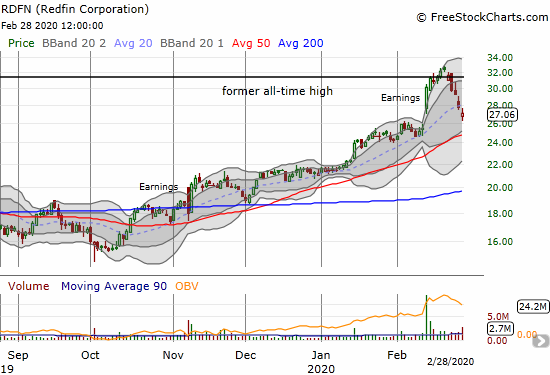
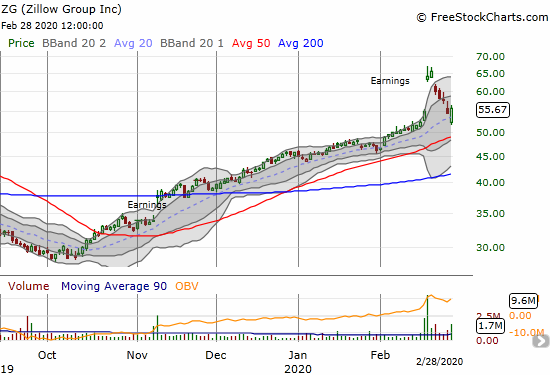
Source for stock charts: FreeStockCharts
Be careful out there!
Full disclosure: long ITB call spread and calls, long SSO, short MTH put, long CCS, long KBH calls