
Bearish Indices and Bullish Reopen Stocks Create Abrupt Rotation – Above the 40 (November 9, 2020)
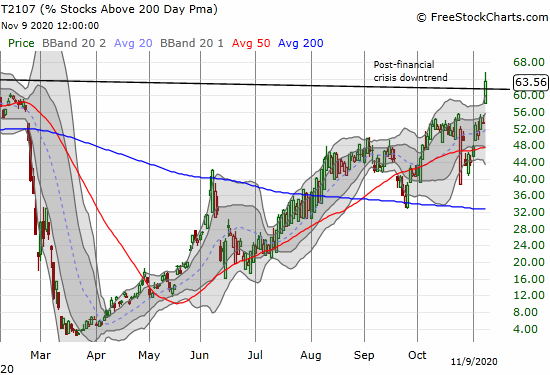
Stock Market Statistics AT40 = 67.8% of stocks are trading above their respective 40-day moving averages (DMAs) (high of 75.1%) AT200 = 63.6% of stocks are trading above their respective 200DMAs (near 3-year high and breakout above post financial crisis downtrend) VIX = 25.8 (as low as 22.4) Short-term Trading Call: neutral Stock Market Commentary … Read more