
Stock Market Statistics
AT40 = 74.1% of stocks are trading above their respective 40-day moving averages (DMAs) (first overbought day, 17 of last 19 trading days overbought)
AT200 = 22.6% of stocks are trading above their respective 200DMAs
VIX = 36.1 (down 11.5%)
Short-term Trading Call: cautiously bullish
Stock Market Commentary
In the last Above the 40 post, I compared last week’s early warning signs and the subsequent promising signs. The promising signs won the day on Friday with the currency markets once again providing a key tell.
The path ahead is fraught with danger and opportunity. The eye-popping parabolic moves that proceeded last week’s one-day plunge suggest that the windows for trading will be short and swift. Price action that should unfold over days, even weeks, can and will happen in a flash.
The Stock Market Indices
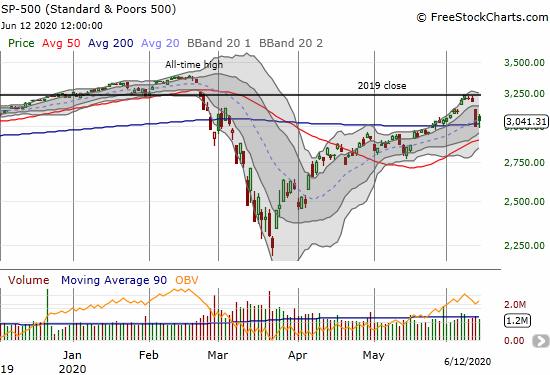
The S&P 500 (SPY) managed to hold onto support at its 200-day moving average (DMA). This pricing action was the most most obvious to watch on the day. I used the 200DMA to flip shares in ProShares Ultra S&P500 (SSO). As long as I am some flavor of bullish, I will use SSO shares to make these kinds of short-window trades on the S&P 500.
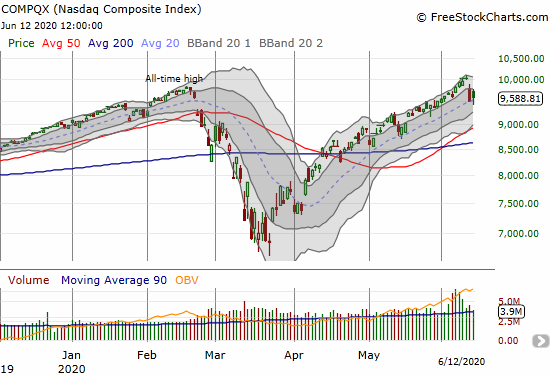
The NASDAQ (COMPQX) had its own fight to maintain support. The NASDAQ gained 1.0% and held onto its uptrending 20DMA. This win was even more important than the S&P 500’s win. The tech-laden NASDAQ even looks ready to resume a steady march higher.
Volatility
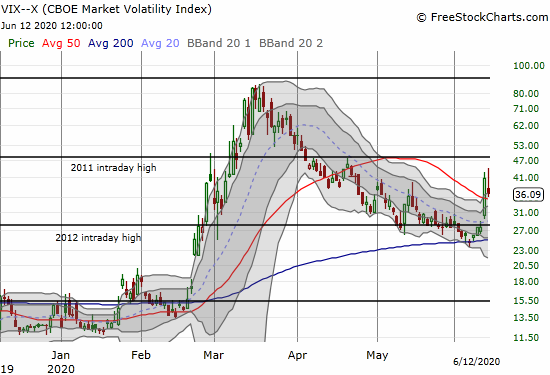
The volatility index (VIX) suffered a major fade on the day. While the VIX looks like it will remain elevated for quite some time to come, I prefer to fade volatility as long as I am some flavor of bullish.
My short on ProShares Ultra VIX Short-Term Futures ETF (UVXY) worked out twice. I immediately covered on the gap down open. I shorted UVXY again when the VIX rebounded through the previous day’s high. When the VIX, and UVXY, faded into the close, I took profits again. Of course missing out on UVXY’s 50.2% gain on Thursday overshadows my skittish profits on two short trades.
Overbought…Yet Again

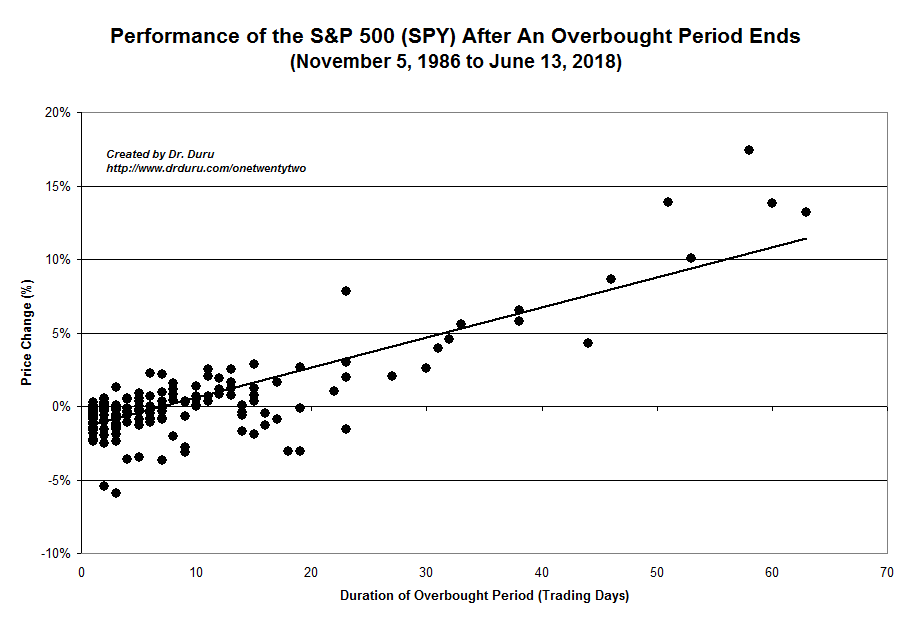
AT40 (T2108), the percentage of stocks trading above their respective 40DMAs, flipped right back into overbought territory with a close at 74.1%. AT40 has now been overbought for 17 of the last 19 trading days. The extended overbought rally essentially is on-going, but I am still reseting the counter. The two quick trips out of and back into overbought trading conditions validate my preference for being slow to flip bearish. If I think of the overbought period as being 17 days long instead of 1 day long, the chart below suggests the S&P 500 is right on the edge of an even more extended run-up.
The Short-Term Trading Call
My short-term trading call remains cautiously bullish for all the same reasons I discussed in the last Above the 40 post. The VIX fade, strengthening in AUD/JPY, the rebounds off critical support levels, and now the return of overbought trading conditions all reinforce keeping the trading call. With 50DMA support rising rapidly on the S&P 500, I am giving a new bearish call more room than usual. A confirmed 50DMA breakdown for the index will be a definitively bearish event.
Stock Chart Reviews: A Video Summary
Stock Chart Reviews – Below the 50DMA
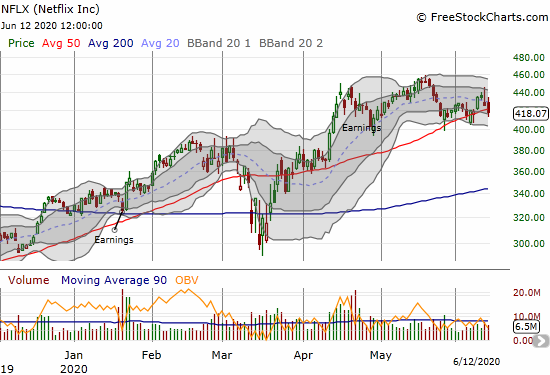
Netflix (NFLX)
I still have a bearish eye tracking Netflix (NFLX). The stock is slowly but surely churning out a type of head and shoulders topping pattern: left shoulder at April’s peak and former all-time high, head at May’s peak and all-time high, and a right shoulder forming with June’s apparent peak. Friday’s underperformance and 50DMA breakdown almost triggered a trade for me, but I decided to wait for a break below this month’s low.
Stock Chart Reviews – Above the 50DMA
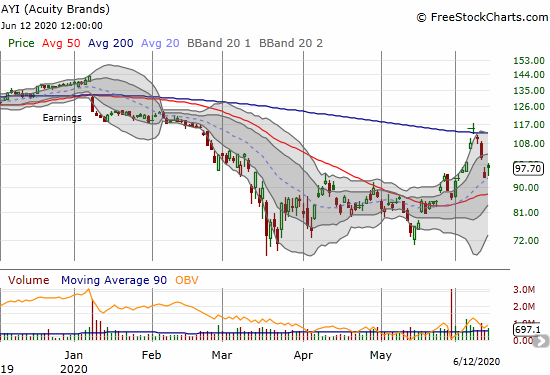
Acuity Brands (AYI)
I expect commercial real estate to suffer as work from home (WFH) looks like a sustained movement for a post pandemic world. Acuity Brands (AYI) sells lighting products mainly to the commercial (and industrial) real estate market. May’s 50DMA breakout put a bearish thesis on hold from a technical perspective. I was even thinking bullish again as AYI began June with a breakout from what looks like a bottoming consolidation pattern.
However, that breakout quickly flipped into a parabolic move that ended badly as most parabolic moves do. On June 8, AYI gapped up and gained 6.2% on a 200DMA breakout. AYI gapped down the next day on a 200DMA breakdown and sellers confirmed the breakdown the next day. AYI left behind a bearish combination: a shooting star and an abandoned baby top. (See “Amazon.com: Stock Faces Biggest Test Since Stock Market Crash” for a similar pattern printed even more ominously at an all-time high).
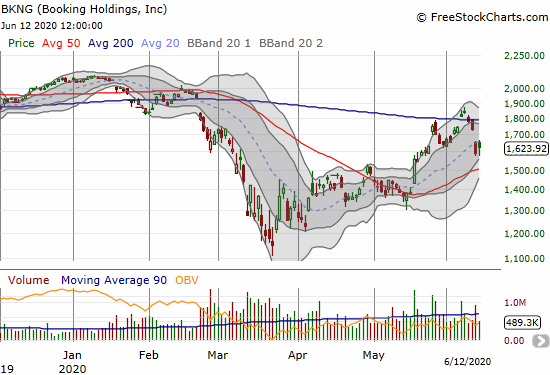
Booking Holdings (BKNG)
Booking Holdings (BKNG) briefly joined the few stocks trading above their respective 200DMAs. BKNG next joined a swell of stocks breaking right back down below the 200DMA. The stock is now in limbo as it levitates above 50DMA support and closed twice below its 20DMA.
Caterpillar (CAT)
Caterpillar (CAT) is also in limbo. I failed to have a handful of CAT puts ready for a potential 200DMA breakdown. I put the strategy on the shelf after the 200DMA breakout. Going forward, I will get more active in keeping CAT puts on hand to partially hedge my bullishness.

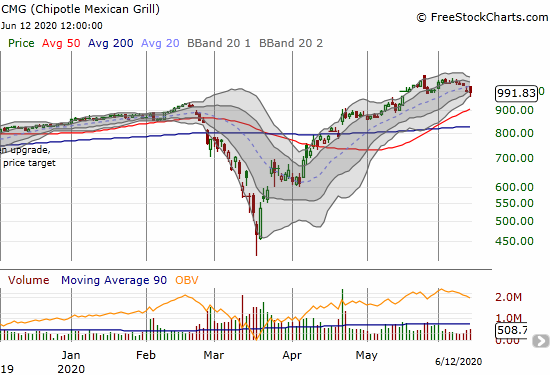
Chipotle Mexican Grill (CMG)
Chipotle Mexican Grill (CMG) likely topped out for a while. CMG printed a bearish engulfing pattern last month. A subsequent rebound printed a marginal new all-time high, but the stock is starting to look “tired.” CMG finally closed below its 20DMA and a Bollinger Band (BB) squeeze is forming. I strongly suspect the resolution of the BB-squeeze will be a move to the downside and a 50DMA breakdown.
I used Chipotle Mexican Grill as an example of how to build rules to protect gains after surviving a market crash. If I were long a significant position in CMG, I would take at least partial profits. Indeed, I would be inclined to cash out completely and chill out on the sidelines for a good while.
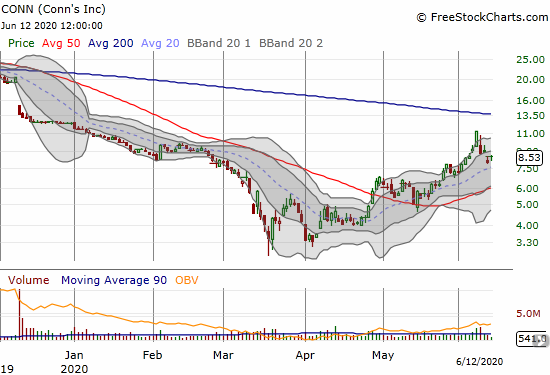
Conn’s (CONN)
I posted Conn’s (CONN) as a speculation special at the end of May. CONN turned into a fortuitous trade as I was able to participate in one of the many parabolic moves the following week. When the stock soared 22.5% on the day ahead of earnings, I had to take profits. Journal CONN as yet one more parabolic move that ended badly: CONN lost 21.1% post-earnings. As the stock calms back down, I am eyeing getting back in around 20DMA support and then 50DMA support.
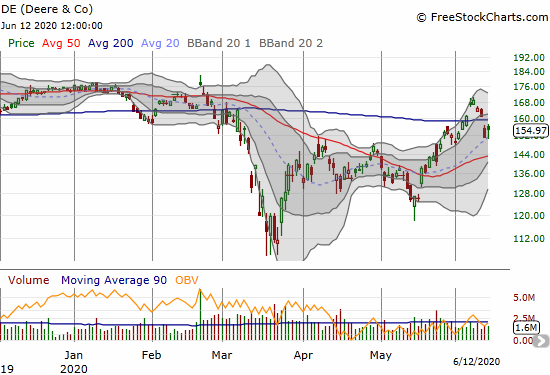
Deere & Co. (DE)
In a familiar pattern, Deere & Co. (DE) lost a brief 200DMA breakout in last Thursday’s stock market meltdown. The stock is in limbo between 20DMA support and 200DMA resistance. If the stock breaks out again, I will buy aggressively. The bearish case is not strong enough for me to consider here.
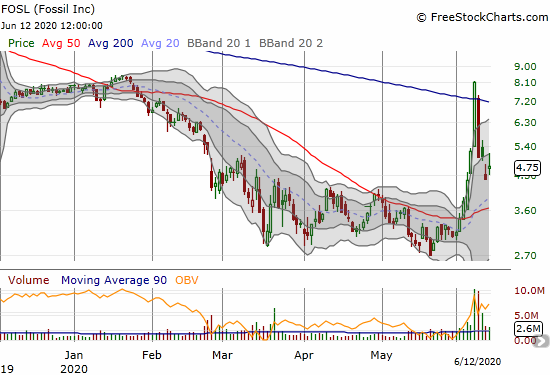
Fossil (FOSL)
In another familiar story, especially for consumer discretionary stocks, Fossil (FOSL) went parabolic to start trading in June. Also familiar, the parabolic move ended badly, exceptionally badly in this case. FOSL was triggered by earnings on June 3rd. One June 8th, the stock soared 54.2% and broke out above its 200DMA for the first time since November 5th. Trading volume soared to 5x the recent average. That achievement blew up the very next day on a 37.9% loss. FOSL is a dangerous stock until it can find some stability at a “natural” level of support like its 20 or 50DMA.
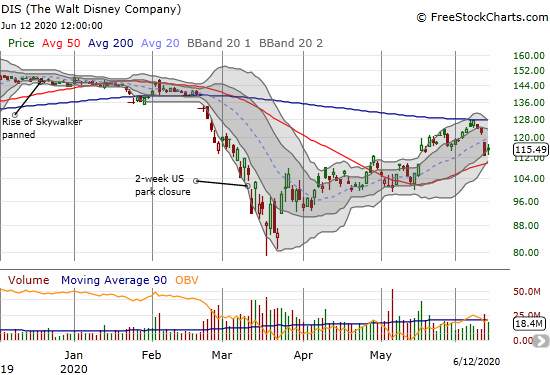
The Walt Disney Company (DIS)
The Walt Disney Company (DIS) is part of a large cohort of stocks that failed to break through 200DMA resistance ahead of last week’s stock market meltdown. Like so many stocks, DIS is now in limbo levitating above its 50DMA. I want to be a buyer on a test of 50DMA support that would also fill the gap up from May 18th. I want to be an even more aggressive buyer on a 200DMA breakout.
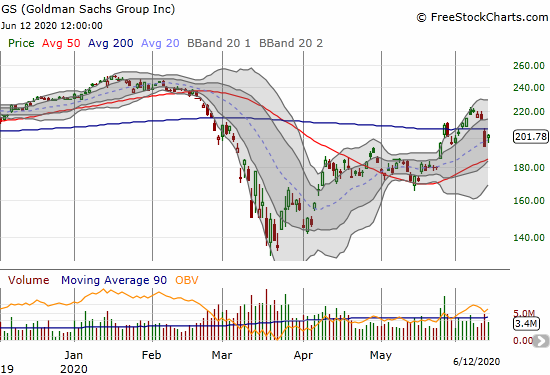
Goldman Sachs Group (GS)
Goldman Sachs Group (GS) held onto its false 200DMA breakout for a full 6 trading days. I thought this breakout would last given it was a comeback from May’s one-day false 200DMA breakout. I moved from a calendar call spread to a vertical call spread during this move. Thursday’s 9.1% plunge completely blew up my trade. GS is in limbo, and I do not expect it to heal easily from Thursday’s big loss.
Live Nation Entertainment (LYV)
I do not know how events company Live Nation Entertainment (LYV) is surviving the pandemic, but the stock did not survive its test of 200DMA resistance. I might consider buying the stock on a test of 50DMA support as a trade on a fresh run for 200DMA resistance.

NVIDIA Corporation (NVDA)
A BB-squeeze is building on semiconductor chip company NVIDIA Corporation (NVDA). I am waiting for the sign to trade on the side of the resolution of this important technical pattern. Unlike my play on the Tesla (TSLA) BB–squeeze, I am content to wait for NVDA to move first.

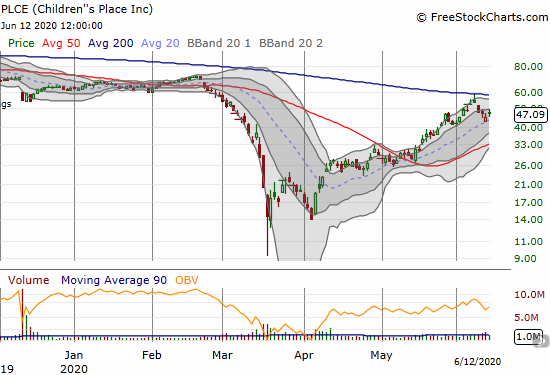
Children’s Place (PLCE)
Retailer Children’s Place (PLCE) failed its test of 200DMA resistance just as the stock finished a full recovery from the March stock market crash. The stock pulled back going into earnings on Thursday. So far, PLCE looks like it is surviving a test of uptrending 20DMA support. I am a buyer here with a tight stop below the 20DMA. Of course, I am looking back at my several trades in and out of PLCE and marveling how much easier it would have been to keep buying and sitting still! Incredibly, PLCE traded as low as $9.00 and as high as $58 in less than 3 months.
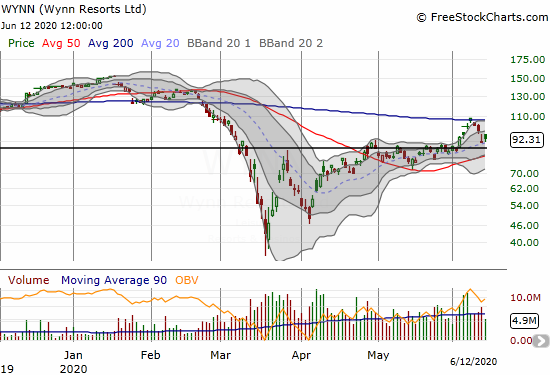
Wynn Resorts (WYNN)
Gambling and hotel company Wynn Resorts (WYNN) is yet one more stock which recently failed at 200DMA resistance. The stock closed 4 straight days above its upper-BB on its way to a 200DMA breakout. WYNN is down 15.2% from that breakout and looks like a buy on a bounce off 20DMA support.
— – —
FOLLOW Dr. Duru’s commentary on financial markets via email, StockTwits, Twitter, and even Instagram!
“Above the 40” uses the percentage of stocks trading above their respective 40-day moving averages (DMAs) to assess the technical health of the stock market and to identify extremes in market sentiment that are likely to reverse. Abbreviated as AT40, Above the 40 is an alternative label for “T2108” which was created by Worden. Learn more about T2108 on my T2108 Resource Page. AT200, or T2107, measures the percentage of stocks trading above their respective 200DMAs.
Active AT40 (T2108) periods: Day #43 over 20%, Day #37 over 30%, Day #35 over 40%, Day #34 over 50%, Day #19 over 60%, Day #1 over 70% (first day of the overbought period, ending 1 day under 70%, overbought 17 of the last 19 trading days)
Daily AT40 (T2108)
")
Black line: AT40 (T2108) (% measured on the right)
Red line: Overbought threshold (70%); Blue line: Oversold threshold (20%)
Weekly AT40 (T2108)

*All charts created using FreeStockCharts unless otherwise stated
The T2108 charts above are my LATEST updates independent of the date of this given AT40 post. For my latest AT40 post click here.
Be careful out there!
Full disclosure: short UVXY shares
*Charting notes: FreeStockCharts stock prices are not adjusted for dividends. TradingView.com charts for currencies use Tokyo time as the start of the forex trading day. FreeStockCharts currency charts are based on Eastern U.S. time to define the trading day.
Really like the Video Summary….
Thanks! I have received some great feedback. I might continue providing the summary here in the blog.