
Stock Market Statistics
AT40 = 47.9% of stocks are trading above their respective 40-day moving averages (DMAs) (2-month low)
AT200 = 21.5% of stocks are trading above their respective 200DMAs
VIX = 33.8
Short-term Trading Call: neutral
Stock Market Commentary
The damage in the stock market is only visible upon close examination.
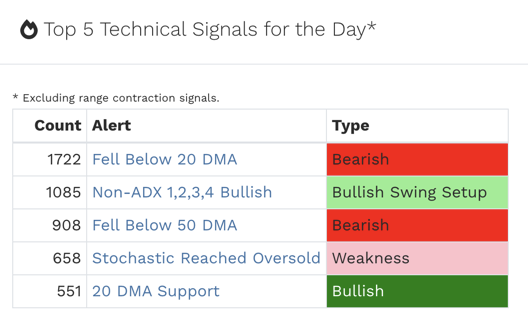
The top technicals for the day as reported by SwingTradeBot were a mix of bearish and bullish signals, but the trampling of support at 20-day moving averages (DMAs) stuck out to me. In addition to the 1,722 stocks that had the misfortune of breaking down below their primary trend support, 908 stocks also fell below their even more important 50DMAs. These stocks were on the frontlines of the prospects for the S&P 500 (SPY) to hold support at the bottom of its current channel. That support for the index looks a lot more shaky even as the 50DMA is rushing upward to refortify the frontlines.
The Stock Market Indices
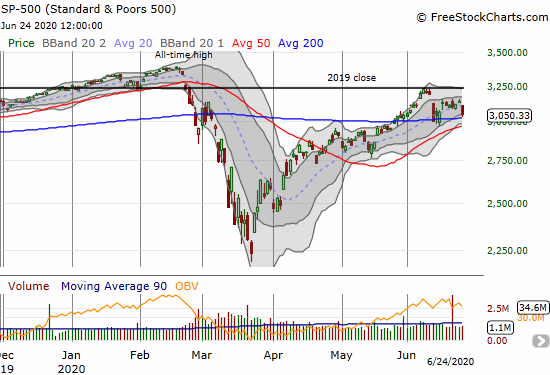
The S&P 500 (SPY) remains trapped between its 2019 close and its 200-day moving average (DMA). The index lost 2.6% and feebly bounced away from its 200DMA support.
The NASDAQ (COMPQX) fell from its all-time high with a 2.1% loss. The tech-laden index neatly stopped short of the former all-time high from February.

Taken together, the S&P 500 and the NASDAQ look like a small bout of hiccups in generally healthy trends. Breaking apart the S&P 500 reveals some of the underlying weakness.
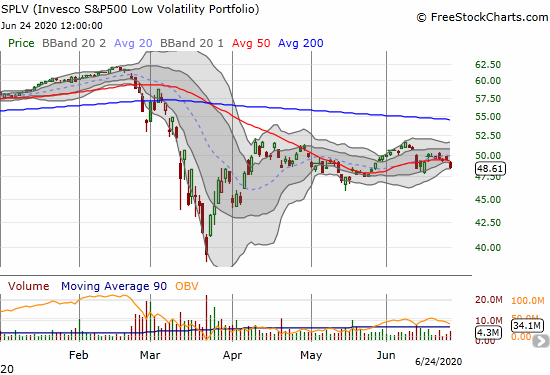
The Invesco S&P 500 Low Volatility Portfolio (SPLV) suffered a fresh 50DMA breakdown. Investors have shown little interest in the “safer” part of the S&P 500 as they instead chose to chase high risk and high beta. At its peak in June, SPLV failed to print higher than the April peak. The index has gone nowhere for almost 3 months.
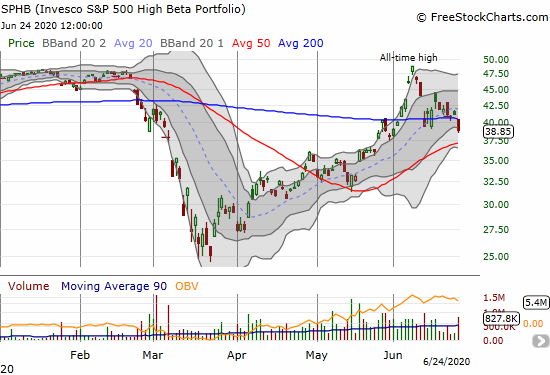
The Invesco SP500 High Beta Portfolio (SPHB) was doing the heavy lifting for the S&P 500. SPHB even reached an all-time high on June 8th at the end of parabolic run-ups across many high-risk, speculative stocks in the stock market. That peak marked the end of panic, catch-up buying outside of a select group of high-tech stocks that have been driving the NASDAQ to new heights. SPHB plunged 5.6% on a bearish 200DMA breakdown. This retreat is symbolic of the implosion I am observing in many speculative stocks.
Taken together, SPLV and SPHB expose weakening foundations of the stock market. They help demonstrate that the selling in the major indices was more than just a hiccup.
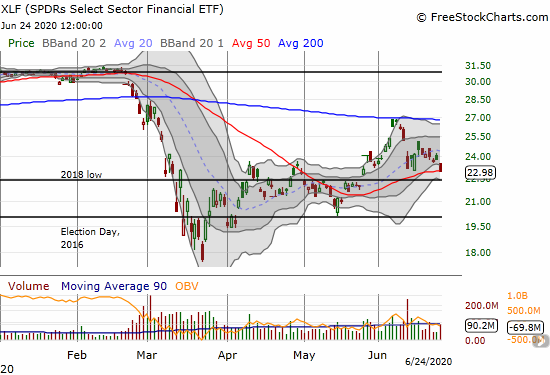
Financials were trampled into 50DMA support as they continue to act like a weight around the market’s metaphoric ankles. The SPDRs Select Sector Financial ETF (XLF) sank 3.5%. XLF closed at a 1-month low and looks ready for a 50DMA breakdown.
Volatility
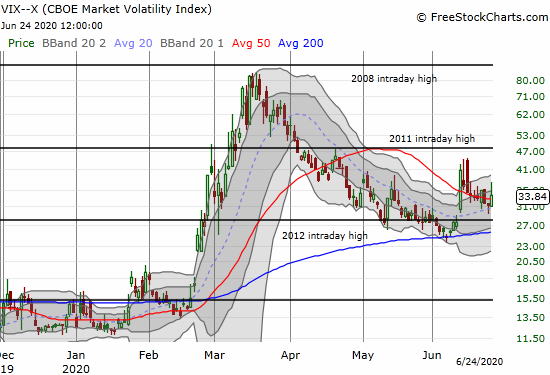
The volatility index (VIX) jumped although the move was not as strong as I would have expected on such a bearish day. The VIX gained 7.9%. Faders drove the VIX off an intraday gain of 18.3%. The fade was just about the only positive signal I observed on the day.
The Short-Term Trading Call
AT40 (T2108), the percentage of stocks trading above their 40DMAs, collapsed all the way down to 47.9% from above 60%. The swift downward move from a stampede of sellers gave me the final confirmation of the bearish turn in the stock market. The pullback also confirmed my expectation that AT40 would retreat swiftly in the face of a pullback to support levels on the S&P 500.
I continue to think the window for bearishness will be short for this cycle, so I am keeping the short-term trading call at neutral. I want to stay mentally prepared to buy into this dip. I am looking for AT40 to drop “close enough” to oversold as the S&P 500 tests 200 and then 50DMA support levels. The psychologically important 3000 level tantalizingly sits between these two important trendlines. (As a reminder, oversold is defined by an AT40 below 20%. I consider the low 30%s as “close enough” to oversold when I think the market is in a bull market mode).
Stock Chart Reviews: A Video Summary
Stock Chart Reviews – Below the 50DMA
The Walt Disney Company (DIS)
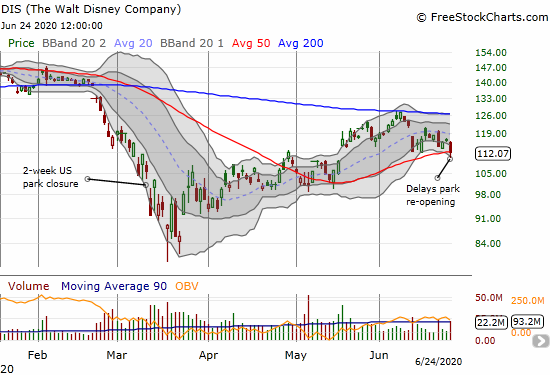
The Walt Disney Company (DIS) just barely joined the group of stocks breaking down below their 50DMAs. The selling came just as news broke of employees petitioning Disney to delay reopening its Florida amusement parks. The entertainment conglomerate announced it will delay the reopening of its amusement parks in Southern California amid a surge in coronavirus cases. This news was one more move symbolic of the very slow and select retreat from the rush to re-open a pandemic-burdened economy. Bears will likely descend upon DIS upon a confirmation of a 50DMA breakdown with a lower close.
At least we can look forward to Hamilton coming to Disney+ on July 3rd just in time for the 4th of July holiday and celebration.
Wynn Resorts Ltd (WYNN)
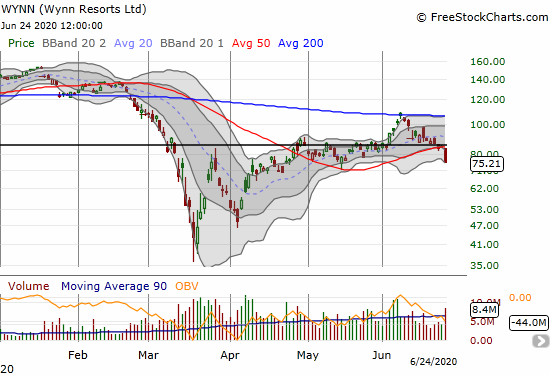
Wynn Resorts (WYNN) was an even more telling sign of a further weakening in the foundations of the stock market. WYNN made a clean break of its 50DMA support on a whopping 11.0% loss. I was previously looking to buy WYNN on a presumed defense of its 50DMA support. Now the stock looks like a short with a stop above the 50DMA.
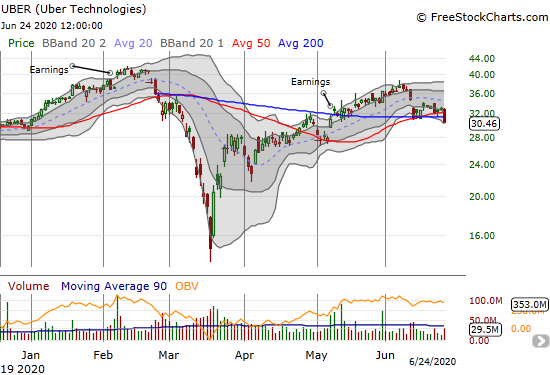
Uber Technologies (UBER)
Uber Technologies (UBER) broke down below BOTH its 50 and 200DMAs. It is a short with a stop above the stock’s 50DMA. If selling really gets going, I highly doubt the $28 level will provide much support like it did in early May. The stock ground steadily higher after reporting earnings last month until that infamous June 8th peak. So a bearish breakdown like this could kick off a rush of sellers looking to protect remaining gains or limit losses.
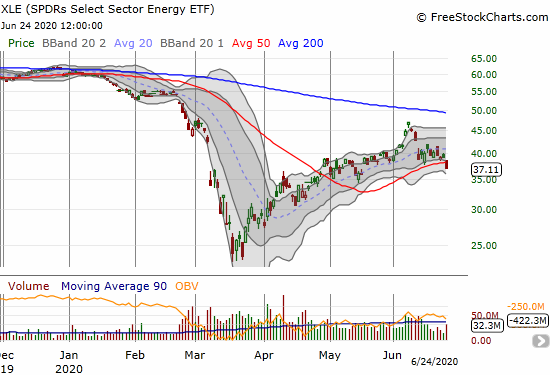
The SPDRs Select Sector Energy ETF (XLE)
The energy sector featured a lot of 50DMA breakdowns. The SPDRs Select Sector Energy ETF (XLE) represents their collective pain. XLE also peaked on June 8th so today’s 50DMA breakdown is a continuation move of profit-takers and the end of speculative fervor.
Stock Chart Reviews – Above the 50DMA
Microsoft (MSFT)
Microsoft (MSFT) represents the solidly bullish side of the market. Even with a 2.0% loss, MSFT still sits comfortably in its trading channel from its upper Bollinger Band (BB). I am a buyer of MSFT call options on a test of 20 or 50DMA support.

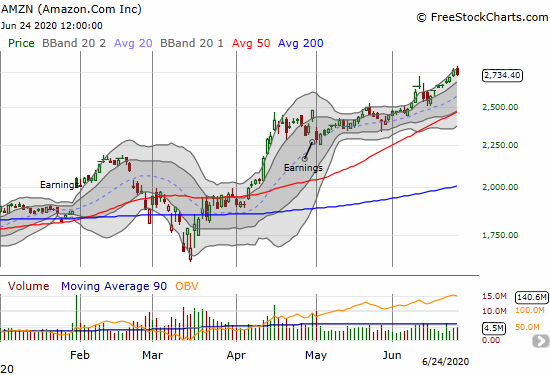
Amazon.com (AMZN)
I earlier featured Amazon.com (AMZN) as a key tell for the market after it printed a bearish evening star pattern. AMZN passed the test with flying colors immediately following my post. The stock proceeded to march steadily higher to fresh all-time highs until today’s 1.1% loss. AMZN easily invalidated the bearish topping signal and is right back in bullish company with MSFT.
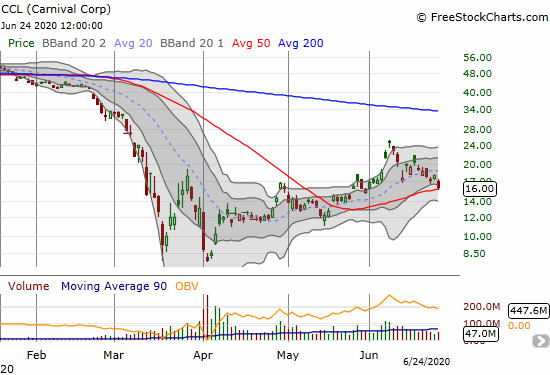
Carnival Corp (CCL)
Carnival Corp (CCL) was yet one more speculative stock that peaked on June 8th after a parabolic move. CCL has trended down since then. The stock somehow managed to hold onto 50DMA support despite an 11.1% loss on the day. I will be watching this stock closely as a 50DMA breakdown will add more evidence to a weakening market as speculative fervor continues to get trampled.
Stock Chart Spotlight – Bullish Breakout
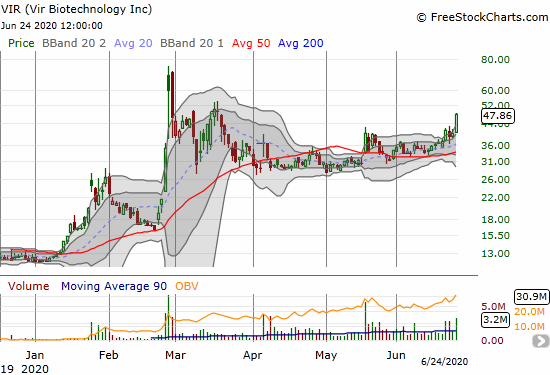
Vir Biotechnology (VIR)
Clinical-stage immunology company Vir Biotechnology (VIR) has the ambitious goal of wiping out infectious diseases. In late February, the stock went straight up from $16.26 to $75 in just 4 days on news of a collaboration in China to fight COVID-19. The stock has not been the same ever since.
However, VIR may have found a bottom through a consolidation process in April and May. A 50DMA breakout on a 32% gain confirmed the re-emergence of buying interest. Today’s surge further confirmed the buying interest. VIR is very speculative, but I want to buy some shares on the next dip (depending on the accompanying news of course).
— – —
FOLLOW Dr. Duru’s commentary on financial markets via email, StockTwits, Twitter, and even Instagram!
“Above the 40” uses the percentage of stocks trading above their respective 40-day moving averages (DMAs) to assess the technical health of the stock market and to identify extremes in market sentiment that are likely to reverse. Abbreviated as AT40, Above the 40 is an alternative label for “T2108” which was created by Worden. Learn more about T2108 on my T2108 Resource Page. AT200, or T2107, measures the percentage of stocks trading above their respective 200DMAs.
Active AT40 (T2108) periods: Day #51 over 20%, Day #45 over 30%, Day #43 over 40%, Day #1 under 50% (ending 41 days over 50%), Day #1 under 60% (ending 26 days over 60%), Day #4 under 70%
Daily AT40 (T2108)
")
Black line: AT40 (T2108) (% measured on the right)
Red line: Overbought threshold (70%); Blue line: Oversold threshold (20%)
Weekly AT40 (T2108)

*All charts created using FreeStockCharts unless otherwise stated
The T2108 charts above are my LATEST updates independent of the date of this given AT40 post. For my latest AT40 post click here.
Be careful out there!
Full disclosure: long CCL
*Charting notes: FreeStockCharts stock prices are not adjusted for dividends. TradingView.com charts for currencies use Tokyo time as the start of the forex trading day. FreeStockCharts currency charts are based on Eastern U.S. time to define the trading day.