
Stock Market Statistics
AT40 = 45.0% of stocks are trading above their respective 40-day moving averages (DMAs)
AT200 = 12.4% of stocks are trading above their respective 200DMAs
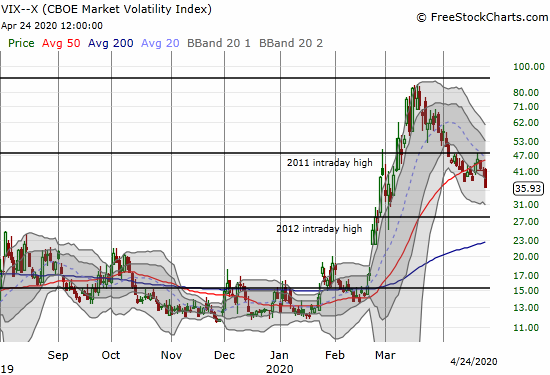
VIX = 35.9
Short-term Trading Call: cautiously bullish
Stock Market Commentary
Last week started on an ominous note with more historic plunges in oil prices. The stock market managed to claw its way back and end the week on a positive and encouraging note. Although the major indices closed the week lower from the previous Friday, AT40 (T2108), the percentage of stocks trading above their respective 40-day moving averages (DMAs), closed at 45.0%, a new high for this post-crash recovery period. While some of this improvement is coming from moving averages closing down on prices, This achievement at least shows that prices are no longer coming down for an increasing number of stocks even as the major indices struggle to confirm major technical breakouts. This divergence could even be mildly bullish.
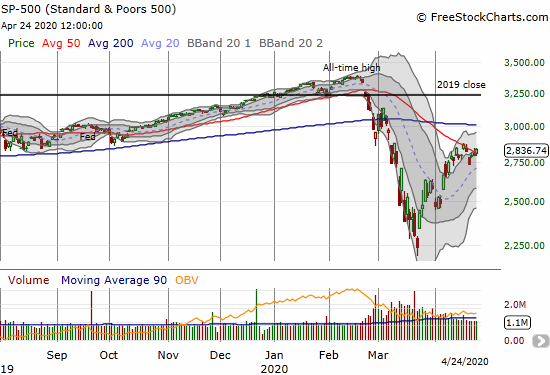
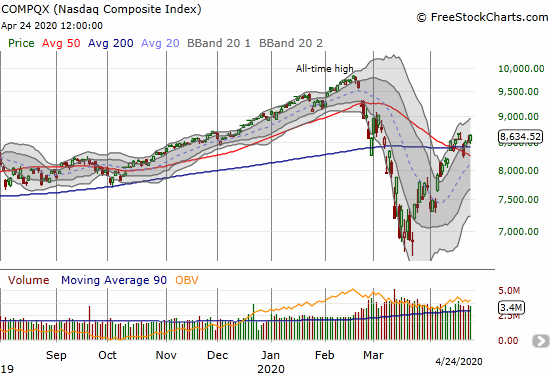
The Stock Market Indices
The S&P 500 (SPY) gained 1.4% as it re-established a pivot with its downtrending 50DMA.
The NASDAQ (COMPQX) gained 1.7% and re-established a confirmed 200DMA breakout. With major tech companies lined up to report this week, the NASDAQ gets a major moment to prove that it remains up to the task of leading the market out of the pandemic and into the new digital economy that lies ahead.
Volatility
The volatility index (VIX) perked up earlier in the week and finally brought its downtrend to an end. Friday’s plunge puts the VIX on track to re-establish that downtrend. The on-going decline in the VIX suggests price swings are settling down. The VIX closed at a 6-week low.
The Short-Term Trading Call
Carter Worth delivered some startling statistics on CNBC’s Fast Money:
- The 5 tech giants – Alphabet, Facebook, Apple, Amazon, and Microsoft – have only reported earnings in the same week two other times in history: 2105 and 2018. The week following the S&P 500 fell 3.7% and 3.9% respectively.
- These big 5 constitute a whopping 20.7% of the S&P 500’s value (for a $5.1 TRILLION share), the same as the bottom 350 of the index.
Worth is suggesting that the market breadth is getting worse, but AT40 is telling me otherwise. I understand the point about the dangers of increasing concentration, but I cannot get worried until AT40 makes a fresh move downward. Recall that part of my bearish thesis going into the March crash was a declining AT40 even as the S&P 500 was pressing all-time highs.
In the meantime, the trading call remains cautiously bullish. I continue to expect the stock market to thrash around as bulls and bears fight to stalemates.
Stock Chart Reviews – Below the 50DMA
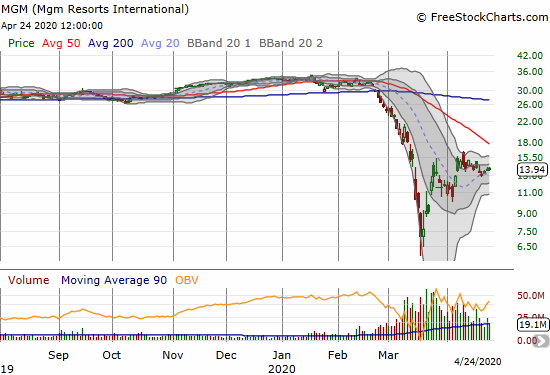
MGM Resorts International (MGM)
Last month, MGM Resorts International (MGM) fell to around $6 per share before rebounding sharply. Like many stocks, that rebound first met resistance at the downtrending 20DMA. A 20DMA breakout this month launched the next phase of recovery. Those gains mainly came in just two days for MGM. Ever since, the stock has mostly drifted along. Now it is clinging to 20DMA support. MGM still seems cheap but the stock is in a no-man’s land. I want to buy this on a retest of the April low.
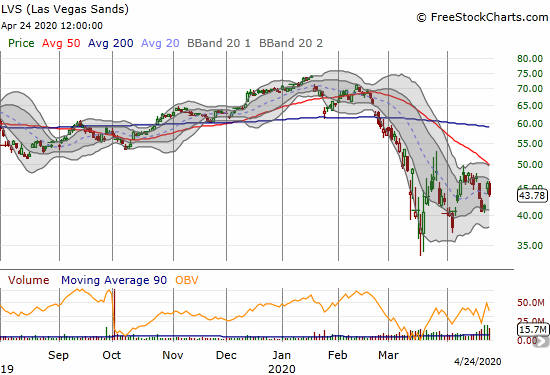
Las Vegas Sands (LVS)
Las Vegas Sands (LVS) popped on earnings on Thursday but on Friday pulled back 4.7%. Overall, the stock is still stuck in a wide trading range in place for about a month. A true test is coming soon with the downtrending 50DMA bearing down on the price action. I am keeping a close eye on plays like this as a gauge of sentiment and technical health of the beaten up components of the stock market.
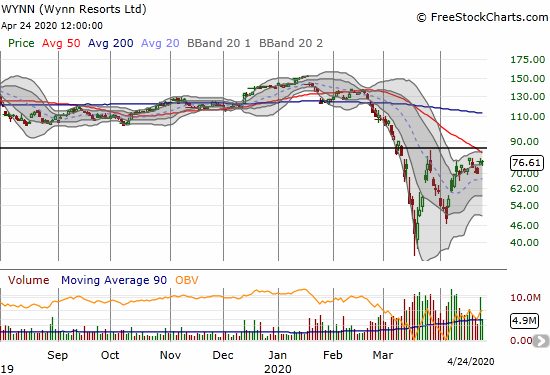
Wynn Resorts Ltd (WYNN)
Wynn Resorts Ltd (WYNN) rounds out my look at gambling plays. A test is coming soon for WYNN as the downtrending 50DMA is looming directly overhead. Like LVS, WYNN is hovering just under its post-crash high which also forms a level of overheard resistance. A breakout from here would be doubly bullish.
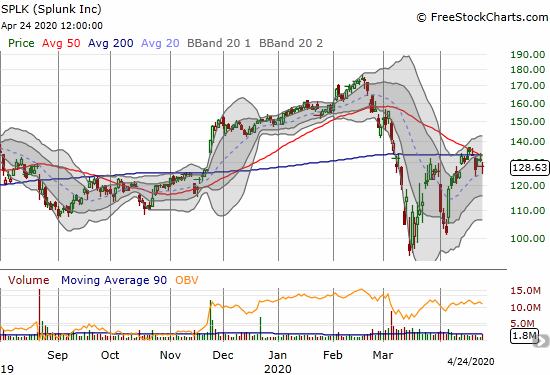
Splunk Inc (SPLK)
Splunk Inc (SPLK) is right at converged overhead resistance from 50 and 200DMAs. So far, the stock is struggling with support at an uptrending 20DMA. As a play on the digital economy, I am surprised SPLK has yet to break through this resistance. If SPLK dips back to $100-110, it will be on my watchlist, but I prefer to buy a breakout.
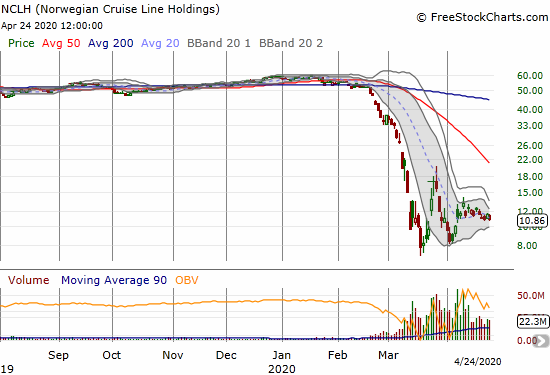
Norwegian Cruise Line Holdings (NCLH)
Cruise lines remain stuck in the beaten up category of the stock market. I am pretty confident there is major multi-year value here, but there is no rush. Customers are not coming back in any significant way until a vaccine exists for coronavirus. Still, it is hard to resist buying stocks like these and tucking them away for the big reveal in a few years…
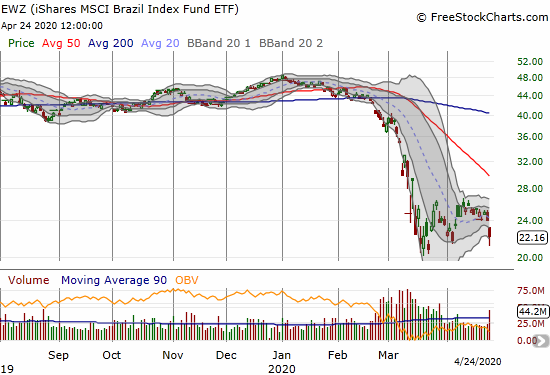
iShares MSCI Brail Index Fund ETF (EWZ)
Brazil is experiencing political turmoil again. There is also churn over management of the coronavirus pandemic looming over the country. Suddenly, I am less happy with my holding in iShares MSCI Brail Index Fund ETF (EWZ). I almost took my small profits earlier this month. Now I am just clinging to the edge of my seat.
Stock Chart Reviews – Above the 50DMA
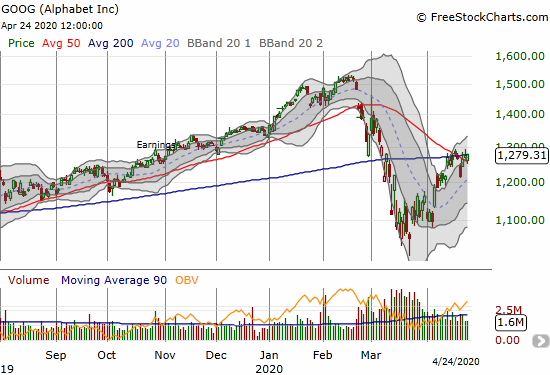
Alphabet Inc (GOOG)
Alphabet Inc (GOOG) has been struggling and pivoting around resistance from its converged 50 and 200DMAs. Earnings are coming up. I am looking for technical resolution from that event. I am looking for support at the uptrending 20DMA.
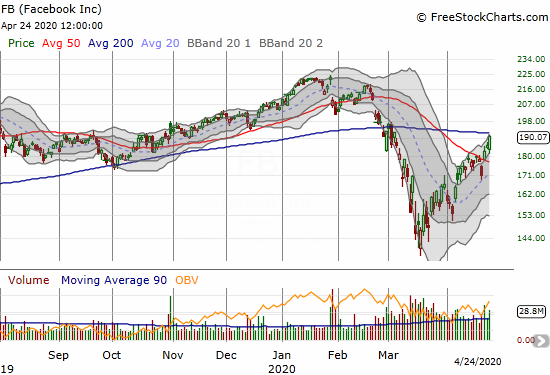
Facebook (FB)
Facebook (FB) confirmed its 50DMA breakout and is now pushing on 200DMA resistance. I was hoping to carry a bullish position into next week’s pre-earnings trade. Friday’s surge was enough to punch my calendar call spread into its initial profit target. It was just enough to offset the put option hedge that expired on Friday. So now I just watch…
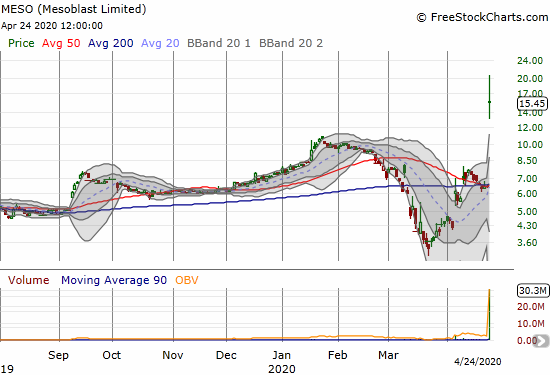
Mesoblast (MESO)
Mesoblast (MESO) added its name to the list of companies producing promising results on coronavirus treatments. The description of the clinical trial did not read any better than the latest results from Gilead Sciences (GILD). Indeed, the evidence is lighter. The test came with just 12 patients with no real control group. Accordingly, these results just set up “the clinical protocol for the randomized, placebo-controlled Phase 2/3 trial of remestemcel-L in ventilator-dependent COVID-19 moderate/severe ARDS patients across North America.” That reality did not stop the market from sending MESO up as much as 210% before settling on an 139.5% gain. If only GILD could generate something even remotely close to this kind of excitement!
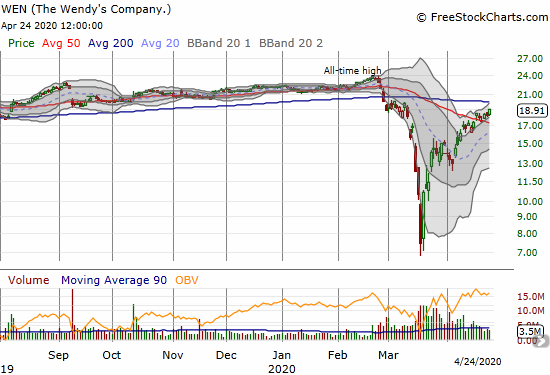
The Wendy’s Company (WEN)
Just ahead of the market crash in March, I targeted The Wendy’s Company (WEN) for taking profits. I missed the window for selling, and I did not even buy the dip as I also planned to do. WEN fell as low as $7 last month. I should have at least doubled down on shares after the big surge from the bottom. Charts like these, with V-like shapes, are reminders of just how deep and overdone the panic became last March. Forced liquidations must be part of the story here.
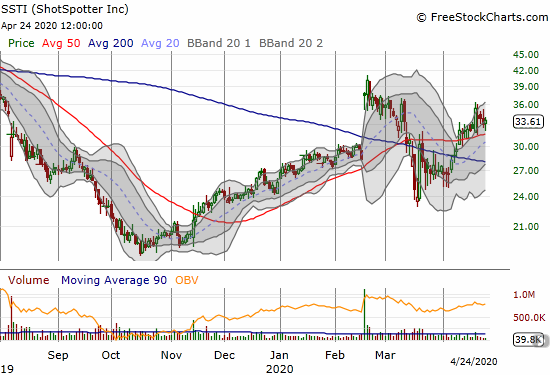
ShotSpotter Inc. (SSTI)
ShotSpotter Inc. (SSTI) is hanging in there pretty well. The stock confirmed a 50DMA breakout and is holding that support line. The stock had a nice 9% surge to start the week but all those gains slowly eroded the rest of the week.
— – —
FOLLOW Dr. Duru’s commentary on financial markets via email, StockTwits, Twitter, and even Instagram!
“Above the 40” uses the percentage of stocks trading above their respective 40-day moving averages (DMAs) to assess the technical health of the stock market and to identify extremes in market sentiment that are likely to reverse. Abbreviated as AT40, Above the 40 is an alternative label for “T2108” which was created by Worden. Learn more about T2108 on my T2108 Resource Page. AT200, or T2107, measures the percentage of stocks trading above their respective 200DMAs.
Active AT40 (T2108) periods: Day #9 over 20%, Day #3 over 30%, Day #1 over 40% (overperiod ending 52 days under 40%), Day #44 under 50%, Day #63 under 60%, Day #67 was under 70%
Daily AT40 (T2108)
")
Black line: AT40 (T2108) (% measured on the right)
Red line: Overbought threshold (70%); Blue line: Oversold threshold (20%)
Weekly AT40 (T2108)

*All charts created using FreeStockCharts unless otherwise stated
The T2108 charts above are my LATEST updates independent of the date of this given AT40 post. For my latest AT40 post click here.
Be careful out there!
Full disclosure: long SSO shares, short UVXY, long GILD shares and calendar call spread, long EWZ, long WEN, long SSTI
*Charting notes: FreeStockCharts stock prices are not adjusted for dividends. TradingView.com charts for currencies use Tokyo time as the start of the forex trading day. FreeStockCharts currency charts are based on Eastern U.S. time to define the trading day.