
Stock Market Launches Deeply Into Overbought Trading Conditions – Above the 40 (April 29, 2020)
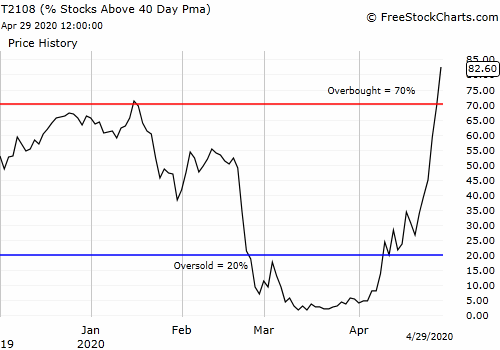
Stock Market Statistics AT40 = 82.6% of stocks are trading above their respective 40-day moving averages (DMAs) (first oversold day)AT200 = 17.7% of stocks are trading above their respective 200DMAsVIX = 31.2Short-term Trading Call: neutral Stock Market Commentary On Tuesday, AT40 (T2108), the percentage of stocks trading above their respective 40-day moving averages (DMAs), rallied … Read more