Housing Market Review (September, 2019) – The Market Data Join the Rally In Home Builder Stocks

Housing Market Intro/Summary In my last Housing Market Review, I finally conceded to a sustained rally in the stocks of home builders. I noted how this stubborn rally moved counter to unimpressive data. In September, several data points finally came together to support the strong sentiment in financial markets. Low interest rates dominate the story … Read more

Home Builder Breakouts: KB Home and Catch-Up Time for Lennar

The grind played out for about 5 months – including a sell-off in June ahead of earnings. Now, KB Home (KBH) finally managed to break out to a new high for the year. KB Home (KBH) finally joined the growing list of home builders breaking to prices last seen last year and earlier. KBH is … Read more

Housing Market Review (July, 2019) – Key Divergences Emerging Under the Surface of the Seasonal Top

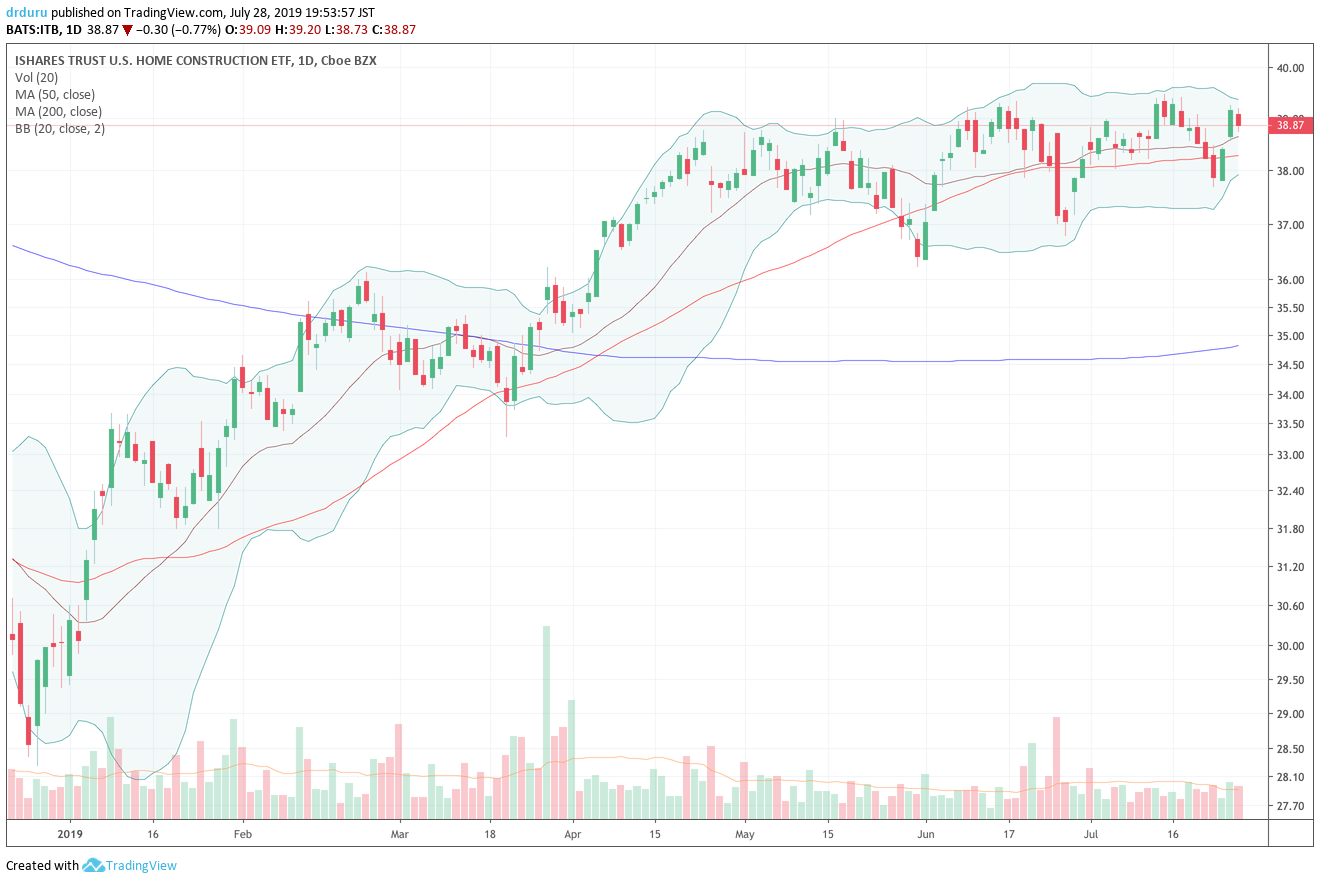
The iShares Dow Jones Home Construction ETF (ITB) continues to pivot around its slowly uptrending 50DMA.

Housing Market Intro/Summary In the last Housing Market Review, I pointed out how the stocks of home builders were still making a surprising push against the expected seasonal top in their shares. Yet, I still expected iShares US Home Construction ETF (ITB) to remain constrained to a pivot around its 50-day moving average (DMA). Soon … Read more

Lennar Hit Hardest By the Weight of Tepid Housing Starts

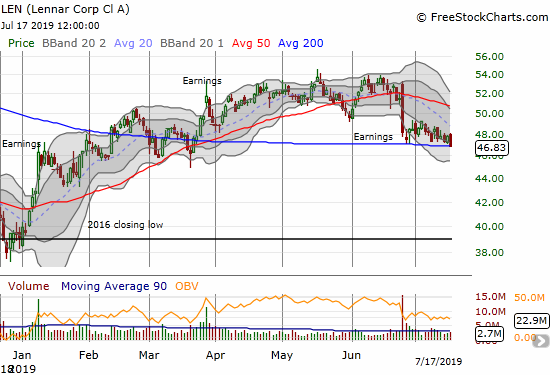
Lennar (LEN) continues to suffer post-earnings weakness. Its close at 200DMA support marks a closing 4-month low.

My wait for an entry point to buy Lennar (LEN) continues. On a day with multiple warning signs about the U.S. economy from companies like Csx Corp (CSX), the Census Bureau piled on with lukewarm data on housing starts. While single-family housing starts for June increased month-over-month by 3.5% to 847,000, housing starts decreased on … Read more

The Whiplash from Lennar Q2 Earnings Presents An Opportunity

The Good When Lennar (LEN) reported earnings on June 25th, the stock market responded with the kind of hesitation and whiplash symbolic of the seasonal topping pattern in place for home builders. The first reaction was celebratory as LEN gapped upward and rallied as high 3.6%. The initial reporting on LEN earnings focused on all … Read more

Housing Market Review (June, 2019) – An On-Going Push Against the Seasonal Top

Housing Market Intro/Summary After writing the last Housing Market Review, I was convinced a triple top had appeared in the iShares US Home Construction ETF (ITB). The May sell-off in the stock market pushed ITB into a breakdown below its 50-day moving average (DMA). Immediately after that post, ITB rebounded right through its 50DMA and … Read more

Housing Market Review (May, 2019) – A (Seasonal) Top Unfolds Amid Rising Confidence and Mixed Demand

Housing Market Intro/Summary In several posts on the housing market, I made the case for a top in the stocks of home builders and pointed out the parallel weaknesses in the housing data. Last week, the iShares US Home Construction ETF (ITB) appeared to confirm what looks like a triple top in the index. Not … Read more

How to Trade the Seasonal Patterns for Home Builder Stocks

(Updated on January 3, 2023 in “How Home Builder Stocks Trade In A Seasonal Pattern“) The Spring selling season is a critical period for the housing market and usually delivers peak activity for the year. This seasonal pattern forms a notable pivot for the stocks of home builders. These stocks typically rally on the wings … Read more

Housing Market Review (March, 2019) – A Recovery Straining Against the Data

Housing Market Intro/Summary In the January Housing Market Review, I described a pause in the bad housing data long enough to allow the stocks of home builders to rally sharply with the stock market. The iShares US Home Construction ETF (ITB) was testing resistance at its 200-day moving average (DMA); that moment turned out to … Read more

Above the 40 (March 29, 2019) – No Follow-Through for Stock Sellers Even As Bonds Fly for Safety

AT40 = 52.3% of stocks are trading above their respective 40-day moving averages (DMAs) (2+ month low)AT200 = 42.6% of stocks are trading above their respective 200DMAsVIX = 13.7 Short-term Trading Call: bearish (caveats below!) Stock Market Commentary The previous Friday’s trading action provided delayed confirmation of my short-term bearish trading call. Last week delivered … Read more