An Ugly Weekly Gain for An Extremely Oversold Stock Market – Above the 40 (March 6, 2020)

AT40 = 9.4% of stocks are trading above their respective 40-day moving averages (DMAs) (8th oversold day)AT200 = 23.2% of stocks are trading above their respective 200DMAsVIX = 41.9Short-term Trading Call: bullish Stock Market Commentary The Shake and Bake bottom barely held as support last week. It was a week of dramatic ups and downs … Read more

Financials Struggle At All-Time Highs

This post is essentially an addendum to “Resilience Cracks: Market’s Bearish Divergence Ends In Topping Pattern.” Financials in the form of the SPDRS Select Sector Financial ETF (XLF) finally achieved an all-time high last month. XLF jumped on December 12, 2019 and trickled higher to the all-time high from there. Since that point, XLF has … Read more

Still No (Trade War) Resolution In the Stock Market – Above the 40 (October 18, 2019)

AT40 = 56.7% of stocks are trading above their respective 40-day moving averages (DMAs)AT200 = 49.9% of stocks are trading above their respective 200DMAsVIX = 14.3Short-term Trading Call: cautiously bearish Stock Market Commentary No Resolution The stock market did little to resolve my lingering skepticism over the meaningfulness of the “Phase One” or partial Trade … Read more

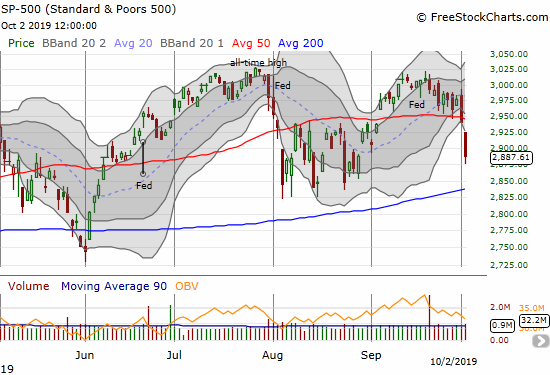
Stock Market Slams Into October’s Average Drawdown In Two Days Flat – Above the 40 (October 2, 2019)

The S&P 500 (SPY) confirmed its 50DMA breakdown with a 1.8% loss, but also closed well below its lower Bollinger Band.

AT40 = 39.0% of stocks are trading above their respective 40-day moving averages (DMAs) (intraday low at 34.5%)AT200 = 45.3% of stocks are trading above their respective 200DMAsVIX = 20.6Short-term Trading Call: cautiously bearish (caveats below) Stock Market Commentary A Broad-Based Exit The selling today was so broad that even Invesco S&P 500 Low Volatility … Read more

Above the 40 (April 13, 2018) – The Bears Engulf An Otherwise Uplifting Week for the Stock Market

AT40 = 45.9% of stocks are trading above their respective 40-day moving averages (DMAs) AT200 = 44.0% of stocks are trading above their respective 200DMAs VIX = 17.4 Short-term Trading Call: neutral Commentary The S&P 500 (SPY) gained 2.0% for the week. Yet the week felt like a loser given the way it ended. The … Read more

Above the 40 (May 31, 2017) – The S&P 500 Makes A Signature Close to May Trading

AT40 = 43.8% of stocks are trading above their respective 40-day moving averages (DMAs) AT200 = 52.6% of stocks are trading above their respective 200DMAs VIX = 10.4 (volatility index) Short-term Trading Call: cautiously bullish Commentary And just like that, the stock market made it even harder for me to keep a bullish bias on … Read more

Above the 40 (April 13, 2017) – The S&P 500 Suffers A Convincing End to Bullish Divergence

AT40 = 38.2% of stocks are trading above their respective 40-day moving averages (DMAs) AT200 = 57.2% of stocks are trading above their respective 200DMAs VIX = 16.0 (volatility index) Short-term Trading Call: cautiously bullish (notable caveats explained below) Commentary The 50-day moving average (DMA) is no longer golden. It figures that on a day … Read more

T2108 Update (June 27, 2016) – Brexit Helps Drive Stock Market Toward Oversold

(T2108 measures the percentage of stocks trading above their respective 40-day moving averages [DMAs]. It helps to identify extremes in market sentiment that are likely to reverse. To learn more about it, see my T2108 Resource Page. You can follow real-time T2108 commentary on twitter using the #T2108 hashtag. T2108-related trades and other trades are … Read more

T2108 Update (June 24, 2016) – A Post-Brexit Menu of Trading Opportunities

(T2108 measures the percentage of stocks trading above their respective 40-day moving averages [DMAs]. It helps to identify extremes in market sentiment that are likely to reverse. To learn more about it, see my T2108 Resource Page. You can follow real-time T2108 commentary on twitter using the #T2108 hashtag. T2108-related trades and other trades are … Read more

T2108 Update (May 26, 2016) – Bargain Shoppers In the Aisle of Late May

(T2108 measures the percentage of stocks trading above their respective 40-day moving averages [DMAs]. It helps to identify extremes in market sentiment that are likely to reverse. To learn more about it, see my T2108 Resource Page. You can follow real-time T2108 commentary on twitter using the #T2108 hashtag. T2108-related trades and other trades are … Read more