
AT40 = 56.7% of stocks are trading above their respective 40-day moving averages (DMAs)
AT200 = 49.9% of stocks are trading above their respective 200DMAs
VIX = 14.3
Short-term Trading Call: cautiously bearish
Stock Market Commentary
No Resolution
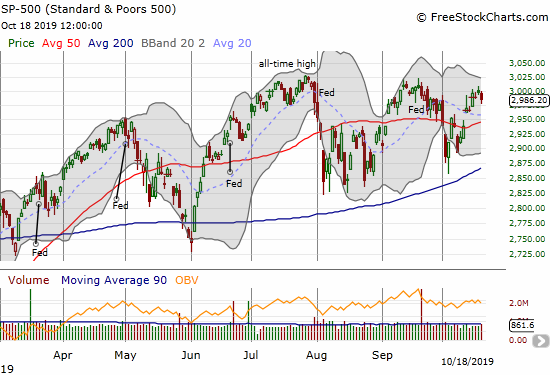
The stock market did little to resolve my lingering skepticism over the meaningfulness of the “Phase One” or partial Trade Deal between the U.S. and China. The S&P 500 (SPY) closed the week with a fractional gain of 0.5% but failed to stay above the intraday high from the previous Friday’s celebration of the Trade Deal. The week’s trading was mostly tepid.
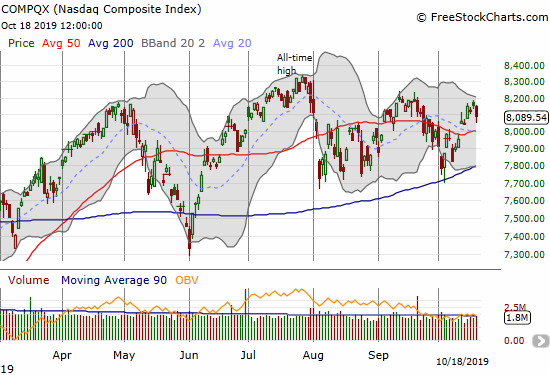
The NASDAQ (COMPQX) almost lost 1% on Friday and also closed below the previous week’s height of optimism. Like the S&P 500, the NASDAQ looks like it failed at resistance from the September highs. At its intraday low, the NASDAQ reversed all its gains for the week.
While the major indices look tired and topped out, the downside potential looks similarly limited. The week’s trading resolved nothing. So while both major indices sit above their 50 and 200-day moving averages (DMAs), I am keeping my short-term trading call at cautiously bearish. In the current context, this call means I look to fade rallies (particularly in individual stocks) until the S&P 500 breaks out above the September high. I am also trading SPY puts until a breakout occurs.
AT40 (T2108), the percentage of stocks trading above their respective 40DMAs gained four points for the week and closed at 56.7%. Last week’s move was enough to finish confirmation of a bottom for October where AT40 traded as low as 30.6%.
Volatility
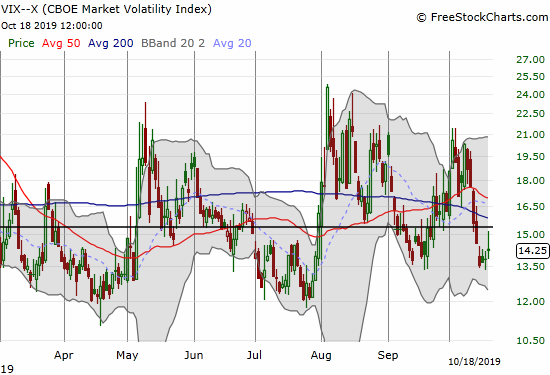
The volatility index (VIX) remained below the 15.35 pivot but managed to hold the line at 13.5 for a low. My last tranche of VIXY call options expired harmless. I went ahead and bought a fresh tranche expiring in two weeks. This trade may be my last going long volatility for a while without a palpable catalyst. I am looking for an increase in volatility going into and/or exiting the Federal Reserve’s next declaration on monetary policy on October 30th.
The market has blithely assumed the Federal Reserve will continue easing as part of a buffer to the economy from the Trade War. With a partial deal in place, the Fed can declare an end to the “emergency” and wait to act until its various members are back in alignment on the direction for monetary policy. In other words, the odds have increased that the Fed will deliver a market unfriendly message. The current odds for a rate cut (25 basis points) at the meeting are already 91.4%. The odds for another rate cut after that do not pass 50% until April – I am particularly skeptical the Fed will cut rates so close to a Presidential election…unless a recession is well underway.
Stock Chart Reviews – Below the 50DMA
Netflix (NFLX)
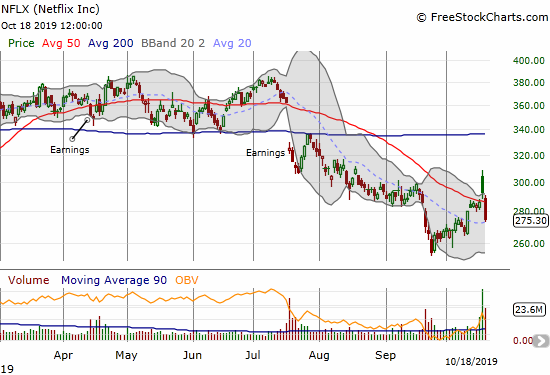
Netflix (NFLX) suffered a major post-earnings gap and crap on Thursday. After gapping higher well above its upper Bollinger Band (BB), sellers quickly took the stock close to 50DMA support. Sellers broke that support on Friday with a 6.2% drawdown. This setback could prove even more damaging than the July gap down that plunged the stock through 50 and 200DMA supports.
Workday (WDAY)
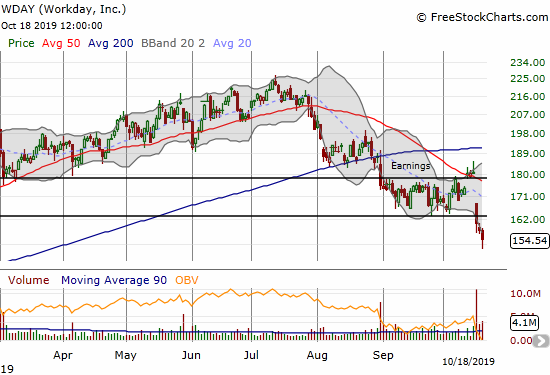
Workday (WDAY) is an expensive stock. WDAY has a forward P/E of 69.6, price/sales of 10.9, and a price/book of 15.9. With quarterly revenue growth over 30%, investors were willing to price WDAY as a growth stock in spite of negative profit and operating margins (financial metrics from Yahoo Finance). However, at these prices, small pebbles in the road can make the speeding bike take a hard tumble.
The stock was looking good going into the Financial Analyst Day with a Goldman Sachs upgrade gapping the stock up and out of its trading range and above its 50DMA resistance (see chart below). Clearly, given an evening to think about the presentation, investors and traders decided WDAY delivered some kind of bombshell. The stock gapped and close below the trading range with an 11.3% loss.
I am a little perplexed by the trading action because all the analyst commentary I read varied from content to optimistic with price targets above $200. Workday even reaffirmed its revenue guidance. I watched the entire webcast and reviewed the slides presented during the event, and I could not find evidence that the company thought it was delivering bad news. The company talked a lot about growth across business segments and geographies with expansion of market share and high retention rates (95%). One of the co-Presidents even said “we couldn’t be more confident about our future.”
Here are some financial highlights:
- “On track” for 200 basis points (bps) improvement in operating margin: 12.3% FY20 estimated and a long-term target of 25%+
- Operating cash flow growth stronger than revenue growth: 51% CAGR from FY15 to estimated FY20 ($102M to $790M)
- Subscription revenue backlog with 27% year-over-year growth
In other words, while the stock clearly broke down into bearish territory, I am not entirely clear why. I am even less clear that other SaaS/cloud stocks should have sold off in sympathy as they did. If sellers do not continue to follow through early in the coming week, I will likely put aside my short-term bearish call on the stock market and buy the downside extremes in some of these software stocks.
At the 1:20:00 mark in the webcast, analyst Keith Bachman from the Bank of Montreal asked a key question: “how do you increase the rate of penetration?” He claimed that the growth over the past few years has come up short versus investor “hopes.” He also asked “where is the friction?” One of the Workday executives on the panel explained that in the financial segment the customer size is smaller so the adoption rates are not applied to as big a base as the HCM (Human Capital Management) customers. She did not really answer the crux of the question though. This moment was the closest I could see to a true negative for the narrative and the stock.
The co-president later talked about growth rates: HCM has slowed to 20%, Financials has increased to 50% (20% of total revenue growth), and new innovations will not show meaningful growth until fiscal year 2022 and beyond. Were investors expecting more from innovations?
I learned a lot about Workday in this webcast. I did not appreciate the breadth and number of Workdays products and feature set or the size of the company’s M&A strategy. For example, Workday recently acquired Adaptive Insights and Stories. Workday is releasing nine new products. Later, one of he co-Presidents proclaimed that Workday has never had more new product launches. The company even talked about implementations with machine learning and blockchain!
One analyst rightfully asked how Workday plans to sell such a large suite of products into the marketplace. The answering executive basically said that they can sell everything because they are creating simplicity for customers. This answer did not truly address what has to be a complex sales process ahead trying to convince customers to buy multiple products, trying to up-sell existing customers, and all at the same time explaining and re-explaining the differences across the product offerings. Perhaps investors are skeptical this aggressive go-to-market strategy will work out well?
WDAY closed the week down 31% from the all-time high set in July. The stock also reversed all of its 2019 gains.
Coupa Software (COUP)
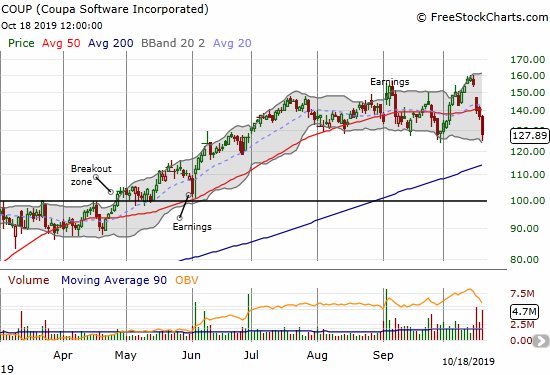
I am so accustomed to seeing buyers rush back into dips in software growth stocks, I snapped up a call option in Coupa Software (COUP) when selling in sympathy with WDAY took COUP to its 50DMA support. The selling continued into the end of the week with a timid bounce off the lower-BB and a close at the September lows. COUP is clinging to the bottom of what looks like a widening trading range (see chart below).
I suspect there is a buying opportunity in the WDAY sympathy pullbacks; the trading action has all the looks of trading algorithms gone wild connecting and correlating a small nugget of news from WDAY to something more ominous across the entire sector.
However, the Workday CEO DID mention Coupa Software by name as a “best in breed” in the procurement. Workday will focus more on this space and hopes to bundle procurement features with its Finance product. Thus, perhaps Coupa’s expensive valuation does need to come down given the competitive firepower coming from Workday. According to Yahoo Finance, COUP has a 337 forward P/E, 25 price/sales, 18 price/book, 54% quarterly revenue growth, and a -19% operating margin – the very definition of expensive!
Even with the latest decline, COUP is up an astounding 103% year-to-date.
MongoDB (MDB)
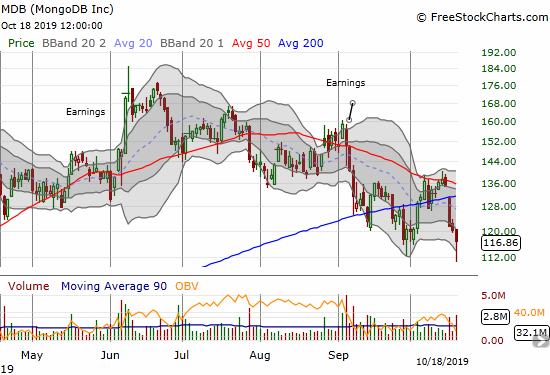
MongoDB (MDB) is still pivoting around its 200DMA, but I think the wait for a definitive move is coming to an end soon, partially thanks to selling in sympathy with WDAY. The latest plunge either finally exhausted sellers or finally spooked buyers to leave the stock alone.
I was fortunate to exit my last position with a profit when the stock recovered from its prior 200DMA breakdown. The sympathy selling on the heels of Workday’s surprise negative news was enough to start another sustained down-cycle for MDB. Buyers stepped into the breach at the lows of Friday, but the stock is slowly transitioning from a buy on the dip/breakdown to a fade at declining 50DMA support…
Atlassian Corporation (TEAM)
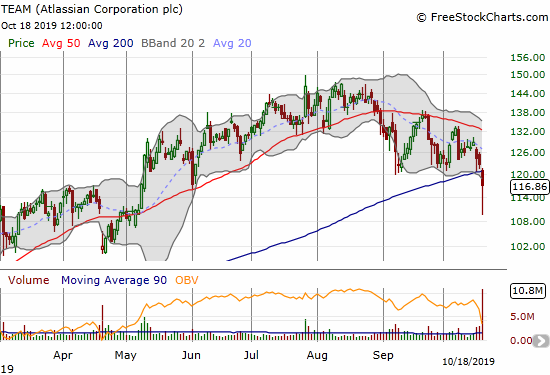
Selling in sympathy with WDAY may have confirmed a top for TEAM with a steep 200DMA breakdown.
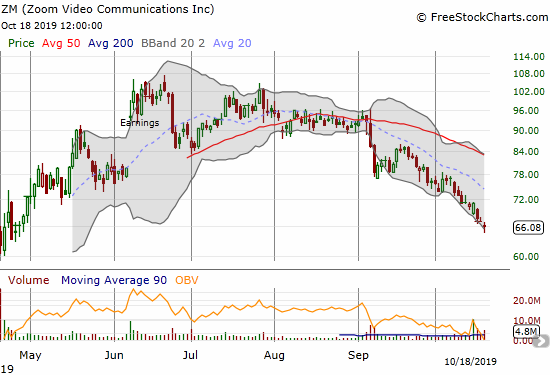
Zoom Video Communications (ZM)
Zoom Video Communications (ZM) rallied for two months after its IPO. The stock has yet to trade higher. A post-earnings 50DMA breakdown in September proved to deliver a lasting blow of bearishness. Still, I assumed the stock might bottom around $70, so I sold a November $70 put short last month. Now, it looks like ZM is headed for a full reversal of its post-IPO gains.
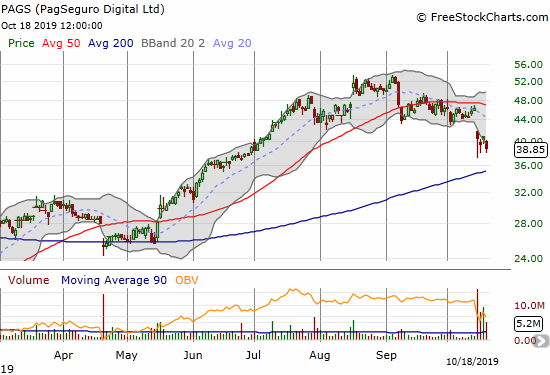
PagSeguro Digital (PAGS)
PagSeguro Digital (PAGS) is a fintech company based in Brazil. The market poorly received the company’s earnings last week. The selling created a gap down that confirmed 50DMA resistance and a topping, head and shoulders pattern.
Stock Chart Reviews – Above the 50DMA
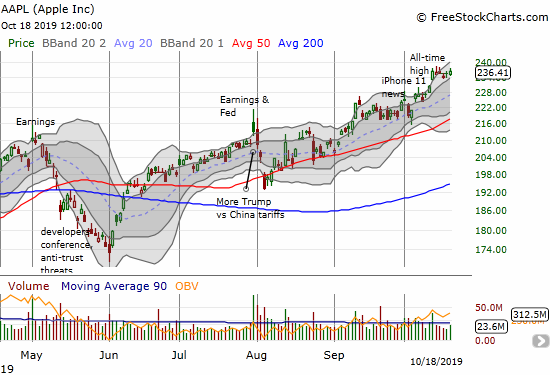
Apple (AAPL)
In my last Above the 40 post, I lamented buying a weekly calendar call spread at the $235 strike. I thought I was not aggressive enough in buying into the breakout to a fresh all-time high. A week later, AAPL closed exactly flat for the week which meant that the calendar call spread delivered close to my desired profit target. I held off from my next weekly call trade in the hopes Monday can deliver a pullback at least to $235. It is difficult to get too bearish on the market with AAPL at all-time highs…
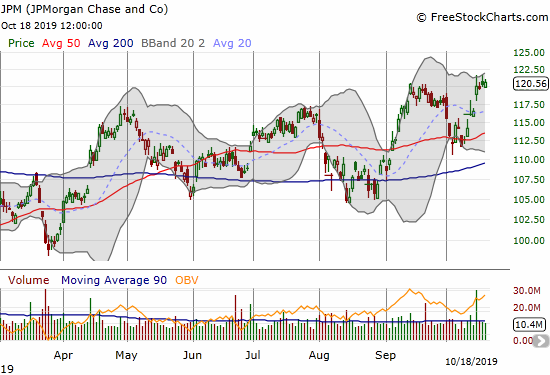
JPMorgan (JPM)
JPMorgan (JPM) delivered a well-received earnings report. The buying momentum was enough to take JPM to a new all-time high. I identified JPM as a buy even while I was cautiously bearish on the general market at the beginning of the month. I took profits on the call options ahead of earnings.
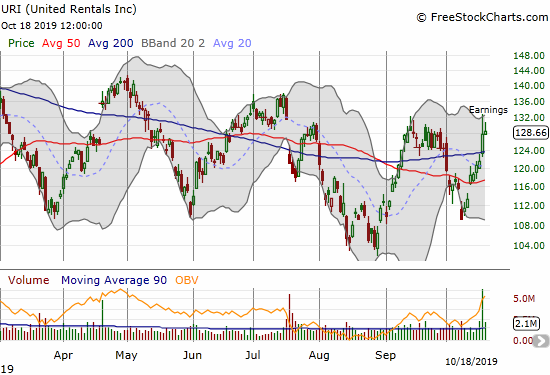
United Rentals (URI)
United Rentals (URI) has been a consistent trade through a near year-long trading range. Earnings last week pushed URI toward the top of this trading range.
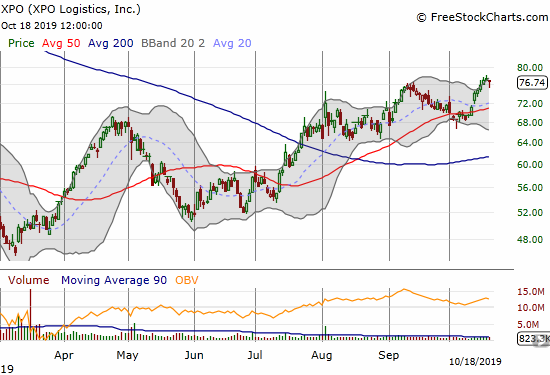
XPO Logistics (XPO)
XPO Logistics (XPO) continues to chug along. I missed the latest buying opportunity with the successful test of 50DMA support earlier in the month. The company’s stock repurchase plan is clearly working with the stock recovering now to an 11-month high.
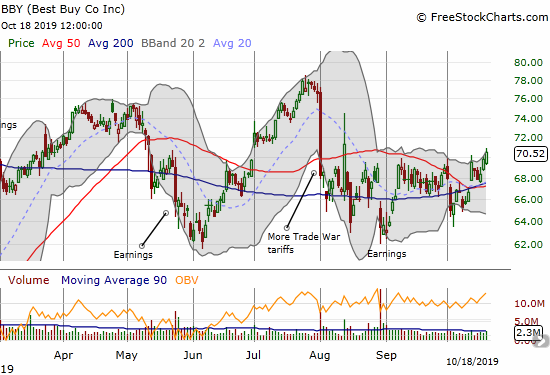
Best Buy (BBY)
When I offered up Best Buy (BBY) as the long side of a Trade War pairs trade, I assumed the stock would surge on good trade news. While BBY did gap up over converged 50/200 DMA resistance in response to the partial Trade Deal, the stock is showing reluctance to rush back to the intraday high from the August pop when President Trump announced a delay in tariffs in order to save Christmas for retailers. While BBY is back in a bullish position, its relative sluggishness is more confirmation of the market’s relative lack of conviction in this Phase One dealing.
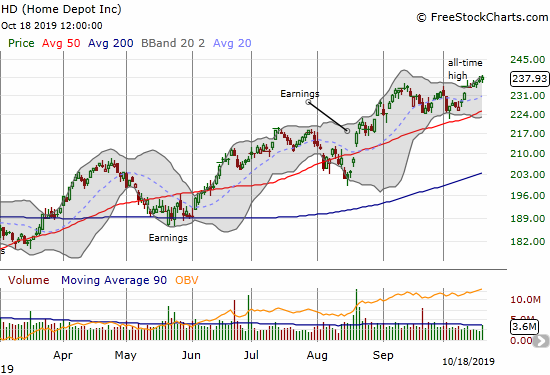
Home Depot (HD)
Home Depot (HD) drifted through several all-time highs last week. I used the strength to take profits on the long side of my Home Depot versus Lowe’s Companies (LOW) pairs trade.
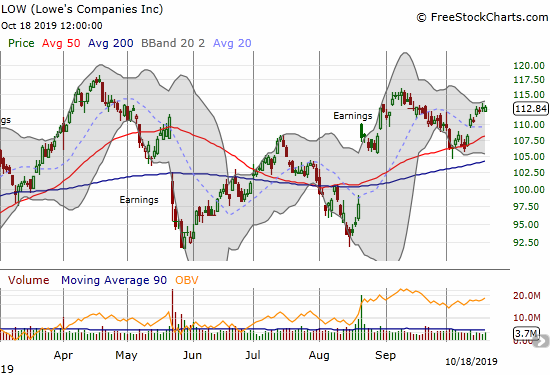
Lowe’s Companies (LOW)
I was tempted to take profits on my Lowe’s Company (LOW) put spread when it slammed into 50DMA support earlier in the month. Instead, I decided to launch the long side of the pairs trade versus Home Depot. I will now wait out the LOW put spread over the next two weeks to expiration.
Alphabet (GOOG)
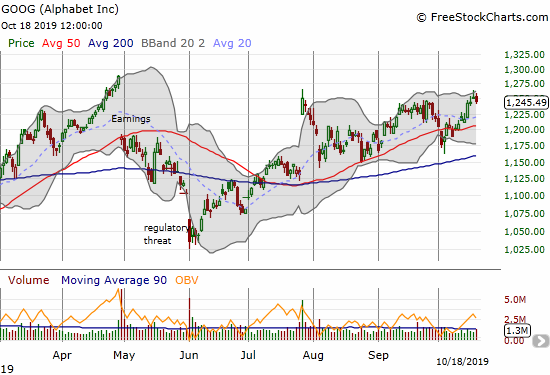
Alphabet (GOOG) has experienced a long post-earnings haul. After an impressive post-earnings gap up in July, the stock qucikly filled that gap by early August. Just ahead of October earnings, the stock is finally just a few points below its post-earnings high from July. The uptrending 50DMA has provided approximate support.
CVS Health Corporation (CVS)
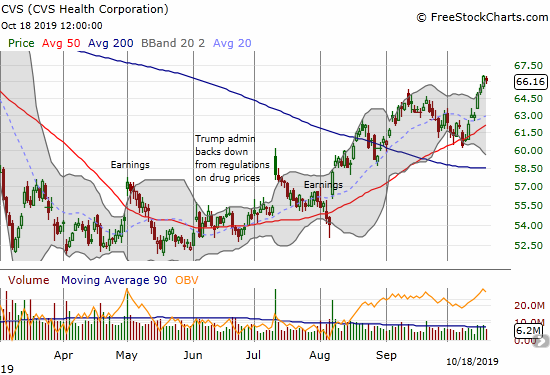
I gave a brief case for buying CVS Health Corporation (CVS). This stock provided a textbook case for buying 200DMA breakouts as a very simple trading strategy. I did not take profits as the stock continued to rally into mid-September. The pullback from there made me think I passed on a great opportunity. I even forgot to buy MORE call options on the subsequent test of 50DMA support. I finally took profits last week.
Walgreens Boots Alliance (WBA)
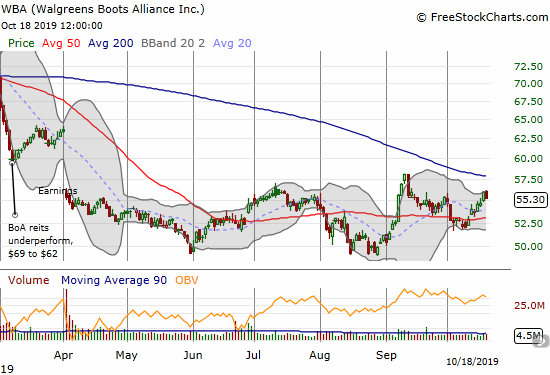
I put my longer-term bearish call on pharmacy stocks on hold in early July. I could have just stuck with my longer-term view. My call options in Walgreens Boots Alliance (WBA) expired harmless. I am close to returning to the bearish thesis; I just need to see what happens at the declining 200DMA resistance.
— – —
FOLLOW Dr. Duru’s commentary on financial markets via email, StockTwits, Twitter, and even Instagram!
“Above the 40” uses the percentage of stocks trading above their respective 40-day moving averages (DMAs) to assess the technical health of the stock market and to identify extremes in market sentiment that are likely to reverse. Abbreviated as AT40, Above the 40 is an alternative label for “T2108” which was created by Worden. Learn more about T2108 on my T2108 Resource Page. AT200, or T2107, measures the percentage of stocks trading above their respective 200DMAs.
Active AT40 (T2108) periods: Day #193 over 20%, Day #32 over 30%, Day #7 over 40%, Day #4 over 50% (overperiod), Day #14 under 60%, Day #20 under 70%
Daily AT40 (T2108)
")
Black line: AT40 (T2108) (% measured on the right)
Red line: Overbought threshold (70%); Blue line: Oversold threshold (20%)
Weekly AT40 (T2108)

*All charts created using FreeStockCharts unless otherwise stated
The T2108 charts above are my LATEST updates independent of the date of this given AT40 post. For my latest AT40 post click here.
Be careful out there!
Full disclosure: long SPY puts, short NFLX shares and long NFLX call, short ZM put option, long LOW put spread, long COUP call, long VIXY calls,
*Charting notes: FreeStockCharts stock prices are not adjusted for dividends. TradingView.com charts for currencies use Tokyo time as the start of the forex trading day. FreeStockCharts currency charts are based on Eastern U.S. time to define the trading day.