General Motors Stock: The Bollinger Bands Drop Before the BrightDrop

The General Motors Company (GM) launched sharply higher out of a Bollinger Band squeeze.

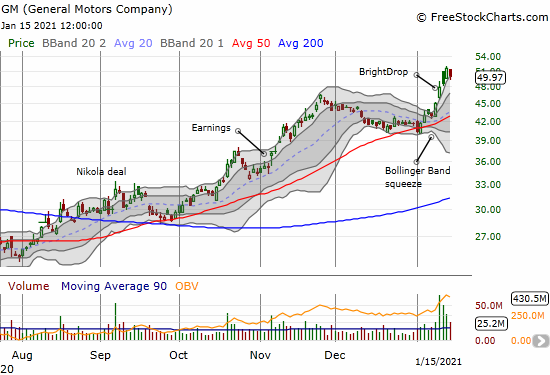
Bollinger Bands (BBs) are a powerful trading tool. They define an expected range of volatility in a stock based on recent price action. When that volatility contracts, the Bollinger Bands squeeze into a narrow channel. The resolution of that squeeze – to the upside or downside – can create a powerful continuation of or change … Read more

Overbought Period Demonstrates Freshly Bullish Sentiment for Stocks – Above the 40 (January 8, 2021)

Stock Market Commentary What a week to start the year’s trading. It started with a definitively bearish end to extended overbought conditions. Overbought conditions bullishly resumed in the middle of the week despite an insurrection in Washington D.C. The week ended with a confirmation of the freshly bullish sentiment in the market. The trading action … Read more

An Extended Overbought Rally Moves Into Historic Territory (Above the 40) – December 18, 2020

Stock Market Commentary The Federal Reserve signaled an incremental improvement in its economic outlook by making an allowance for limited stock repurchases and dividends by the country’s top financial institutions. As a result, bank stocks apparently soared in after hours trading. That fresh rally in financials should extend to a positive open on Monday and … Read more

Bearish Indices and Bullish Reopen Stocks Create Abrupt Rotation – Above the 40 (November 9, 2020)

AT200 (T2107) surged 10 percentage points to close near a 3-year high and a breakout above the post financial crisis downtrend.

Stock Market Statistics AT40 = 67.8% of stocks are trading above their respective 40-day moving averages (DMAs) (high of 75.1%) AT200 = 63.6% of stocks are trading above their respective 200DMAs (near 3-year high and breakout above post financial crisis downtrend) VIX = 25.8 (as low as 22.4) Short-term Trading Call: neutral Stock Market Commentary … Read more

The Stock Market Pushes Through Its 50DMA Resistance – Above the 40 (September 28, 2020)

Stock Market Statistics AT40 = 33.6% of stocks are trading above their respective 40-day moving averages (DMAs) AT200 = 42.6% of stocks are trading above their respective 200DMAs VIX = 26.2 Short-term Trading Call: cautiously bullish Stock Market Commentary The major indices bounced out of oversold trading conditions only to face down the immediate challenge … Read more