
Stock Market Statistics
- AT40 = 33.6% of stocks are trading above their respective 40-day moving averages (DMAs)
- AT200 = 42.6% of stocks are trading above their respective 200DMAs
- VIX = 26.2
- Short-term Trading Call: cautiously bullish
Stock Market Commentary
The major indices bounced out of oversold trading conditions only to face down the immediate challenge of overhead resistance from 50-day moving averages (DMAs). Today, NASDAQ jumped right over its 50DMA resistance, and the S&P 500 closed at 50DMA resistance.
The Stock Market Indices
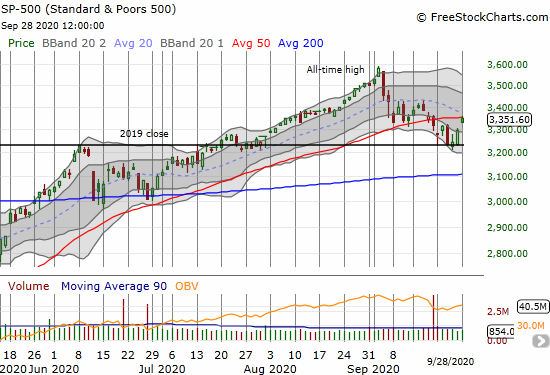
The S&P 500 (SPY) confirmed support at the 2019 close with a 1.6% gain. The index closed right on top of its 50DMA resistance and just below its now downtrending 20DMA.
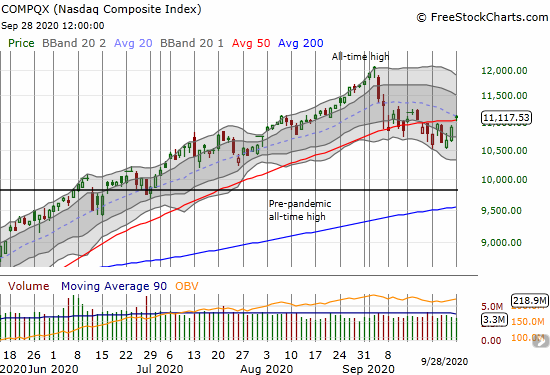
The NASDAQ (COMPQX) made a bullish move by breaking out above its 50DMA resistance. The 1.9% gain took the tech-laden index right to its downtrending 20DMA.
Stock Market Volatility
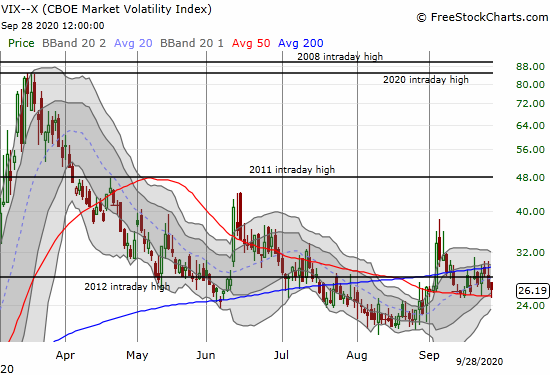
The volatility index (VIX) barely budged with a 0.7% loss. As a result, the VIX looks like it is ready to surge at any point. I expected the VIX to plunge on such a major rally day, so I assume traders got busy buying cheap protection ahead of likely pre-election churn.
The Short-Term Trading Call Against 50DMA Resistance
The short-term trading call is one confirmed 50DMA breakout on the S&P 500 away from going bullish from cautiously bullish.
AT40 (T2108), the percentage of stocks trading above their respective 40DMAs, surged out of the 30% underperiod and closed at 33.6%. AT200 (T2107), the percentage of stocks trading above their respective 200DMAs, was even more impressive with a jump to 42.6%. The index almost finished a reversal of last week’s steep loss. The rally out of and away from oversold conditions is broad and bullish…so far.
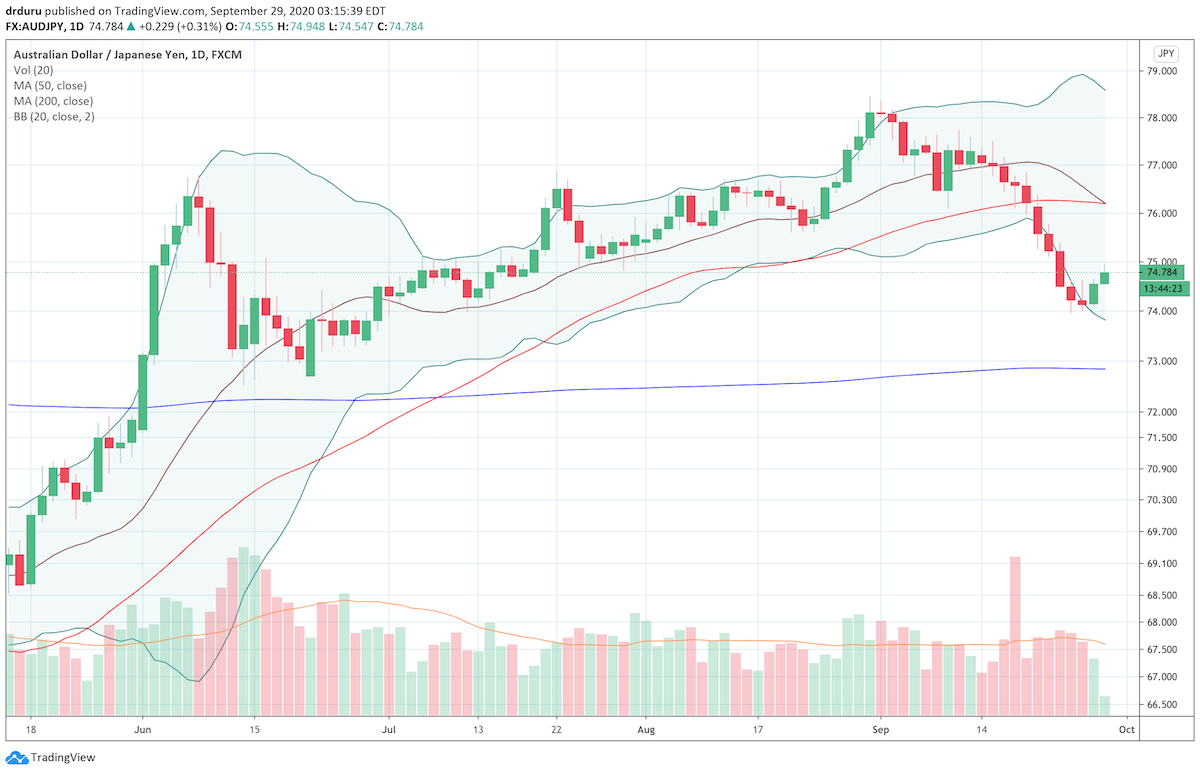
And so far, the currency market is confirming the bounce with the Australian dollar versus the Japanese yen (AUD/JPY) bouncing in synch. AUDJPY peaked right at August 31st and ominously failed to confirm the S&P 500’s surge to the September 2nd all-time high. Once again, this indicator of risk attitudes proved its worth to traders.
Stock Chart Reviews – Below the 50DMA
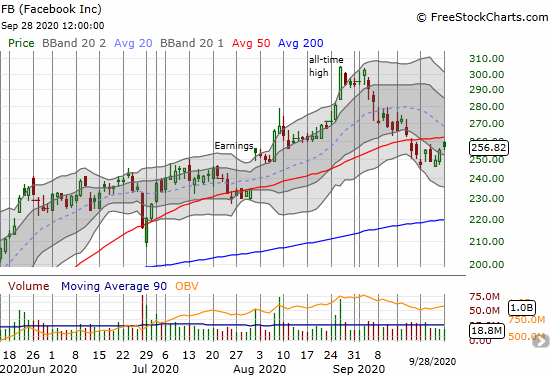
Facebook (FB)
With the NASDAQ powering above its 50DMA resistance, I looked for candidate big cap tech stocks for short-term speculation. I bought calls on Facebook (FB) given the presumed upside potential from a 50DMA breakout. I am also leaning FB’s recent history of resilience in the face of a lot of bad news.
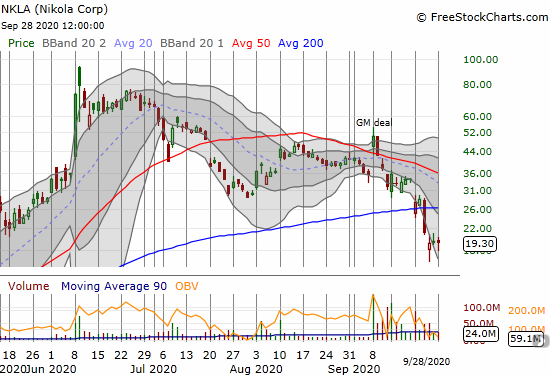
Nikola (NKLA)
I made another change in my positioning in Nikola (NKLA). I took profits on the short call and pared my speculation to shares and a put option. My original idea was to come out the other side with shares purchased at a steep discount. Instead, with the Nikola story bordering on fraud, I have to acknowledge downside risk to something just north of zero. If NKLA rallies almost any amount ahead of the October expiration of the put option, I will lock in my remaining profits and call it quits.
Despite the situation deteriorating so quickly off the news of the GM deal, I did at least prove out the method of setting up a “sleep soundly at night” position on an extremely speculative position… minus the potential for fraud.
Stock Chart Reviews – Above the 50DMA
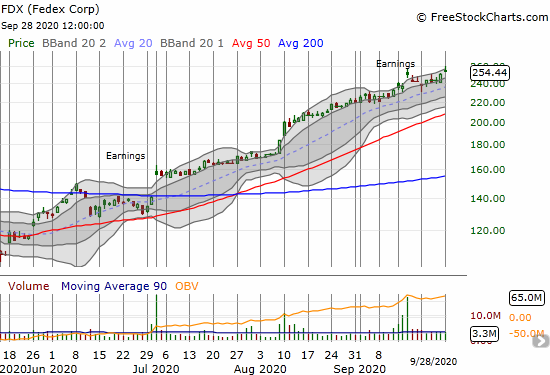
Fedex Corp (FDX)
Fedex (FDX) invalidated its post-earnings topping pattern with a new post-earnings high. FDX is on my buy list for an October or November call spread that will allow me to ride the coattails of a steady churn higher on the current tread through the upper Bollinger Band (BB) channel.
Target Corporation (TGT)
Target (TGT) gained 12.7% post-earnings in August. The stock failed to make further gains until today’s jump to a new all-time high. TGT found loose support around its 20DMA. The 20DMA breakout was a minor, but still important, fresh buying signal.

Bullish 200DMA Breakout
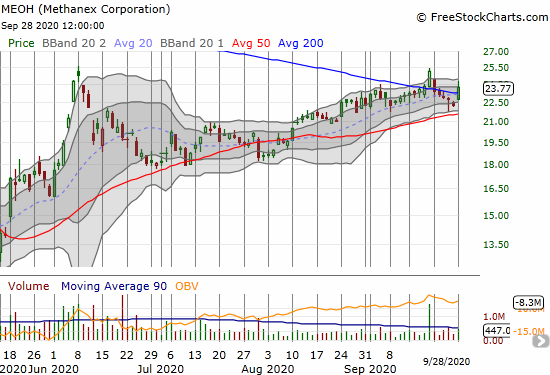
Methanex Corp (MEOH)
Chemical company Methanex Corp (MEOH) bounced away from 50DMA support last week and today broke out above its 200DMA. I want to buy on a higher close as MEOH makes a fresh run to break out above the June high. Recall that industrial type stocks are my preferred way to play this new bullish phase in the market. I expect these stocks to be more resilient than technology stocks in the next sell-off.
— – —
FOLLOW Dr. Duru’s commentary on financial markets via email, StockTwits, Twitter, and even Instagram!
“Above the 40” uses the percentage of stocks trading above their respective 40-day moving averages (DMAs) to assess the technical health of the stock market and to identify extremes in market sentiment that are likely to reverse. Abbreviated as AT40, Above the 40 is an alternative label for “T2108” which was created by Worden. Learn more about T2108 on my T2108 Resource Page. AT200, or T2107, measures the percentage of stocks trading above their respective 200DMAs.
Active AT40 (T2108) periods: Day #2 over 20%, Day #1 over 30% (overperiod ending 3 days under 30%), Day #6 under 40% (underperiod), Day #15 under 50%, Day #17 under 60%, Day #20 under 70%
Daily AT40 (T2108)
")
Black line: AT40 (T2108) (% measured on the right)
Red line: Overbought threshold (70%); Blue line: Oversold threshold (20%)
Weekly AT40 (T2108)

*All charts created using FreeStockCharts unless otherwise stated
The T2108 charts above are my LATEST updates independent of the date of this given AT40 post. For my latest AT40 post click here.
Be careful out there!
Full disclosure: long QQQ put spread, long UVXY, long FB calls, long NKLA shares and put
*Charting notes: FreeStockCharts stock prices are not adjusted for dividends. TradingView.com charts for currencies use Tokyo time as the start of the forex trading day. FreeStockCharts currency charts are based on Eastern U.S. time to define the trading day.