A Stock Market Content to Drift Higher No Matter What – Above the 40 (November 22, 2019)

AT40 = 53.7% of stocks are trading above their respective 40-day moving averages (DMAs)AT200 = 52.7% of stocks are trading above their respective 200DMAsVIX = 12.3Short-term Trading Call: neutral Stock Market Commentary The S&P 500 (SPY) pulled back slightly last week as the stock market’s underlying bearish divergence finally proved too heavy. Yet, the pullback … Read more

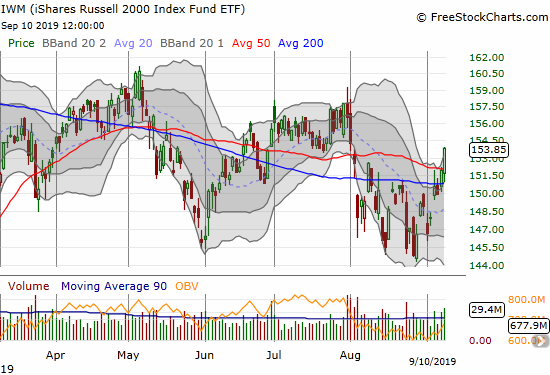
Small Caps Answer the Call: Overbought Trading Conditions Now Approach – Above the 40 (September 10, 2019)

The iShares Russell 2000 Index Fund ETF (IWM) has surged through 200 and 50DMA resistance in a high-volume breakout move.

AT40 = 62.1% of stocks are trading above their respective 40-day moving averages (DMAs) AT200 = 55.2% of stocks are trading above their respective 200DMAs (finished reversing all of August’s decline)VIX = 15.2Short-term Trading Call: neutral Stock Market Commentary Role reversal While the S&P 500 (SPY) and the NASDAQ (COMPQX) continue to fail at confirming … Read more

Above the 40 (June 22, 2018) – Stock Market Bears Increase the Pressure

AT40 = 63.1% ƒof stocks are trading above their respective 40-day moving averages (DMAs) AT200 = 54.7% of stocks are trading above their respective 200DMAs (a 4-month high) VIX = 13.8 Short-term Trading Call: bearish Commentary In my last Above the 40 post, I described how growing global trade wars are creating widening divergences in … Read more

Above the 40 (August 9, 2017) – A Stock Market Pushing Against A Bearish Divergence

AT40 = 45.5% of stocks are trading above their respective 40-day moving averages (DMAs) AT200 = 53.5% of stocks are trading above their respective 200DMAs VIX = 11.1 (volatility index) Short-term Trading Call: neutral (first day of downgrade) Commentary The stock market had a weak open but a strong close. On the heels of ratcheting … Read more

Above the 40 (May 2, 2017) – Tech Stocks Snatch Center Stage As the Rest of the Market Awaits the Fed

AT40 = 58.3% of stocks are trading above their respective 40-day moving averages (DMAs) AT200 = 61.1% of stocks are trading above their respective 200DMAs VIX = 10.6 (volatility index) Short-term Trading Call: bullish Commentary At the end of April, I noted how the stock market headed into May trading with a mix of alerts. … Read more

Charts to Trade: HDP, ISRG, FTNT, BOX, WIX

This is a quick post on five charts that caught my eye on Tuesday, May 19th. All charts annotated at and downloaded from FreeStockCharts.com. Hortonworks, Inc. (HDP) has struggled to make a good post-IPO impression. The first earnings report underwhelmed and led to a fresh all-time low. The last earnings report was initially well-received and … Read more

T2108 Update (May 8, 2015) – Volatility Plunges As Half 2015’s Gain Arrives In One Day

(T2108 measures the percentage of stocks trading above their respective 40-day moving averages [DMAs]. It helps to identify extremes in market sentiment that are likely to reverse. To learn more about it, see my T2108 Resource Page. You can follow real-time T2108 commentary on twitter using the #T2108 hashtag. T2108-related trades and other trades are … Read more

T2108 Update (November 21, 2014) – Overbought for A Hot Minute With Breakout Charts Galore

(T2108 measures the percentage of stocks trading above their respective 40-day moving averages [DMAs]. It helps to identify extremes in market sentiment that are likely to reverse. To learn more about it, see my T2108 Resource Page. You can follow real-time T2108 commentary on twitter using the #T2108 hashtag. T2108-related trades and other trades are … Read more

T2108 Update (November 6, 2014) – A Market Launching Pad (includes chart reviews)

(T2108 measures the percentage of stocks trading above their respective 40-day moving averages [DMAs]. It helps to identify extremes in market sentiment that are likely to reverse. To learn more about it, see my T2108 Resource Page. You can follow real-time T2108 commentary on twitter using the #T2108 hashtag. T2108-related trades and other trades are … Read more

T2108 Update (August 19, 2014) – A Gut-Check on Sentiment As the S&P 500 Rolls On

(T2108 measures the percentage of stocks trading above their respective 40-day moving averages [DMAs]. It helps to identify extremes in market sentiment that are likely to reverse. To learn more about it, see my T2108 Resource Page. You can follow real-time T2108 commentary on twitter using the #T2108 hashtag. T2108-related trades and other trades are … Read more