Stock Market Commentary:
What was resistance for over two months is slowly becoming support for the stock market. The bullish trading action of the last week created an important breakout that confirmed the bottoming action from the previous week’s bullish engulfing pattern. While the stock market may continue to chase its tail before fighting its way higher, the trading action is more constructive as the last of the year’s most dangerous months comes to an end. Three escapes from oversold conditions further underline the positive change in trading mechanics.
The market had several potential catalysts. Fed speak about a smaller rate increase in December dominated financial headlines as a source of rally-worthy news. However, I found more importance and meaning in the commentary from American Express (AXP) in its earnings report (from the Seeking Alpha transcript):
“Card Member spending remained at near record levels in the quarter…we expected the recovery in travel spending to be a tailwind for us, but the strength of the rebound has exceeded our expectations throughout the year…
…As we sit here today, we see no changes in the spending behaviors of our customers, and our credit metrics continue to be strong with delinquencies and write-offs remaining at low levels even as loan balances are steadily rebuilding. Of course, we are mindful of the mixed signals in the broader economy. As always, we have plans in place to pivot should the operating environment change dramatically. And we’ve been taking thoughtful risk management actions to be prepared in the event of a downturn.”
In other words, despite the Fed’s aggressive hiking, American Express’s slice of the economy has yet to suffer. The economy experienced two consecutive quarters of negative growth which many automatically assume means a recession has already started (see “Why Wall Street Wants A Recession” for more background on the traditional definition of a recession and why it is intuitive but misplaced). Companies like American Express continue to demonstrate that a recession has not begun. Indeed, AXP further emphasized they do not yet see the need to act as if a recession is here:
“We’ve got our recession playbook, you have a credit cycle playbook, and we’ll pull that playbook lever if we need to pull it. But to pull it at this particular point in time, does it make any sense. We’re seeing strong growth and we’re seeing strong credit results overall. So right now, nothing new.”
Could a recession still be on the way? Of course. Still, the conventional wisdom and understandings of the economy continue to get disrupted by today’s reality, from monetary policy to inflation to recession. Accordingly, it makes little sense to look past today’s strengthening technicals and instead choose to trade on the potential for a future recession.
The Stock Market Indices
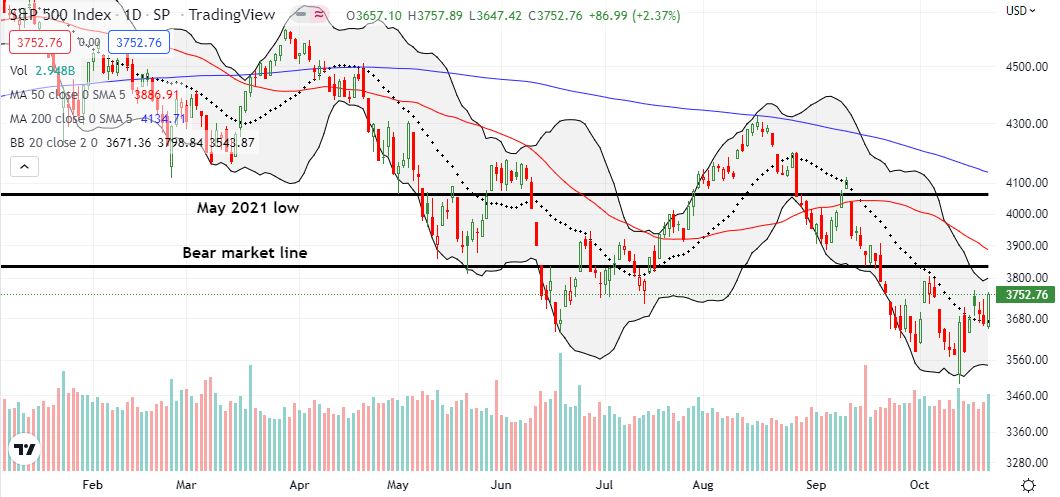
The S&P 500 (SPY) ended the week with a 2.4% gain and a 2-week high. More importantly, buyers successfully defended the 20-day moving average (DMA) (the dotted line below) as support. Tuesday’s gap above the 20DMA was the first clean close above the 20DMA since mid-August. The higher close on Friday confirmed the breakout and support while also closing the gap down from the 20DMA failure earlier in October. Traders transformed 20DMA resistance to support. Moreover, this move confirmed the bullish engulfing bottom carved out of the chart in the previous week. The bear market line awaits as the next big challenge for the index. This challenge could keep the S&P 500 chasing its tail before a resolution occurs.
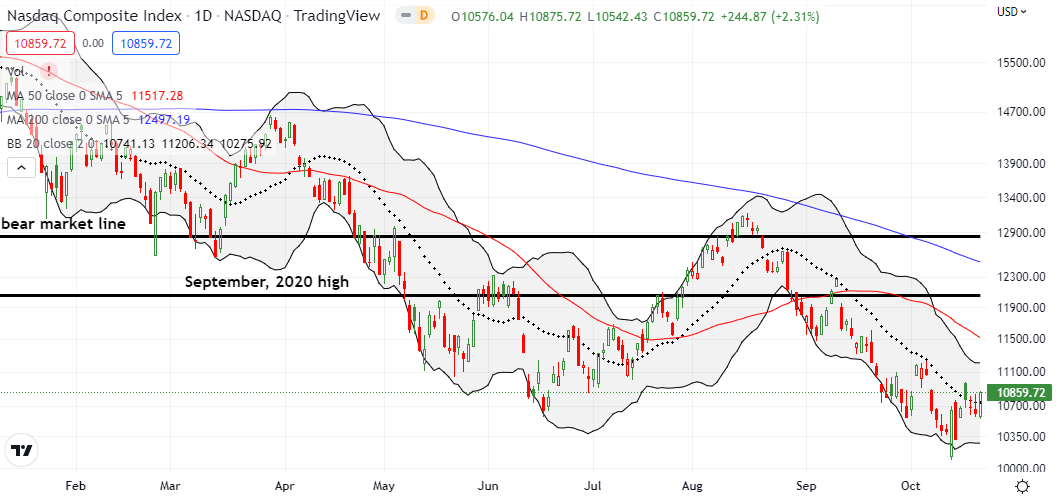
The NASDAQ (COMPQ) had a similar gain to the S&P 500 with a 2.3% rally on Friday. The tech-laden index also achieved a 2-week closing high. However, the NASDAQ did not fill its gap down from the earlier 20DMA failure. The NASDAQ also started below its 20DMA before closing above it. So it needs a higher close to confirm a 20DMA breakout and in turn secure the bottom from the previous week’s bullish engulfing pattern.
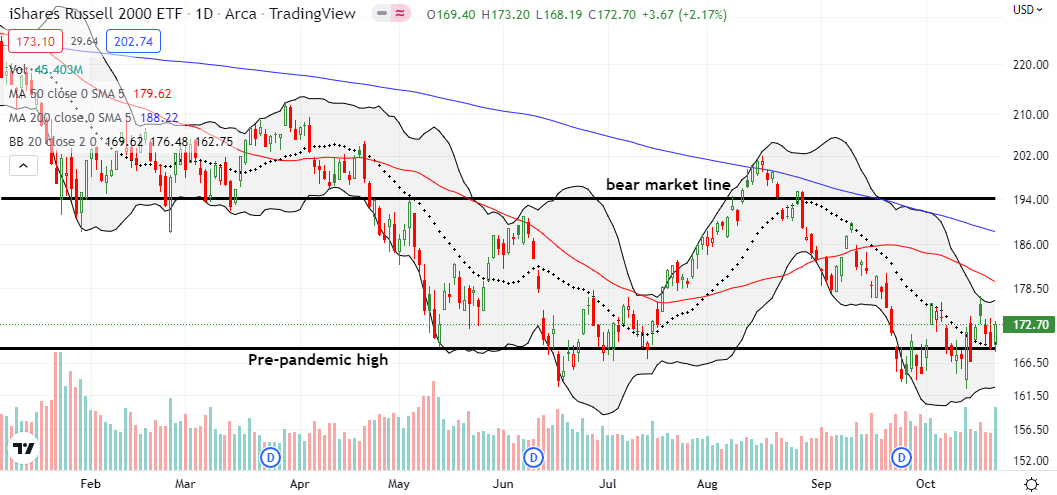
The iShares Russell 2000 ETF (IWM) failed to close the week at a fresh 2-week high. However, I give the ETF of small caps a pass given it already successfully defended its June lows. Moreover, IWM is bouncing off converged support from its 20DMA and the pre-pandemic high, a doubly meaningful trading dynamic. IWM also changed resistance to support by spending the entire week above its 20DMA.
Stock Market Volatility
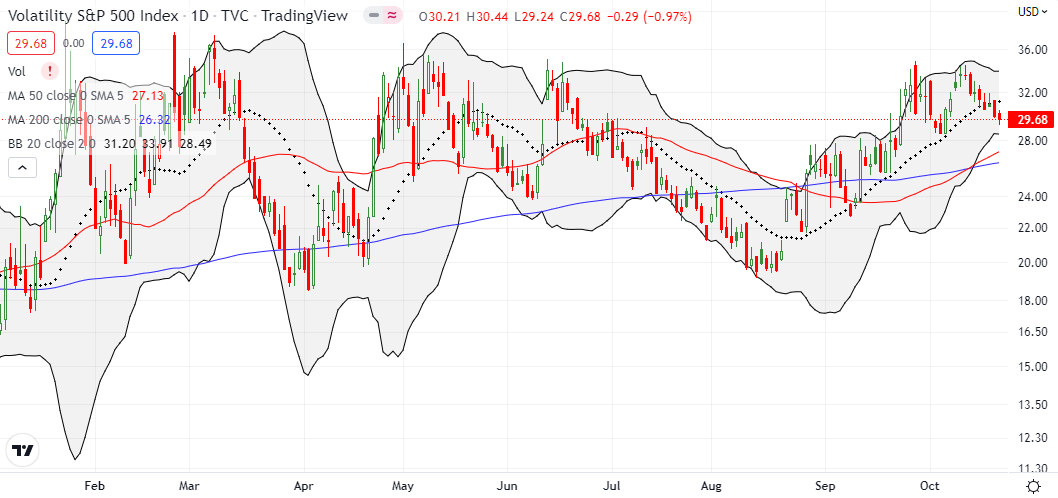
The uptrend for the volatility index (VIX) came to an end as the market moved from 20DMA resistance to support. While the VIX remains at elevated levels, last week’s trend breakdown helps support the case for more constructive trading in the near future. I will get concerned again if the VIX rallies back into its previous uptrend channel.
The Short-Term Trading Call Moving Resistance to Support
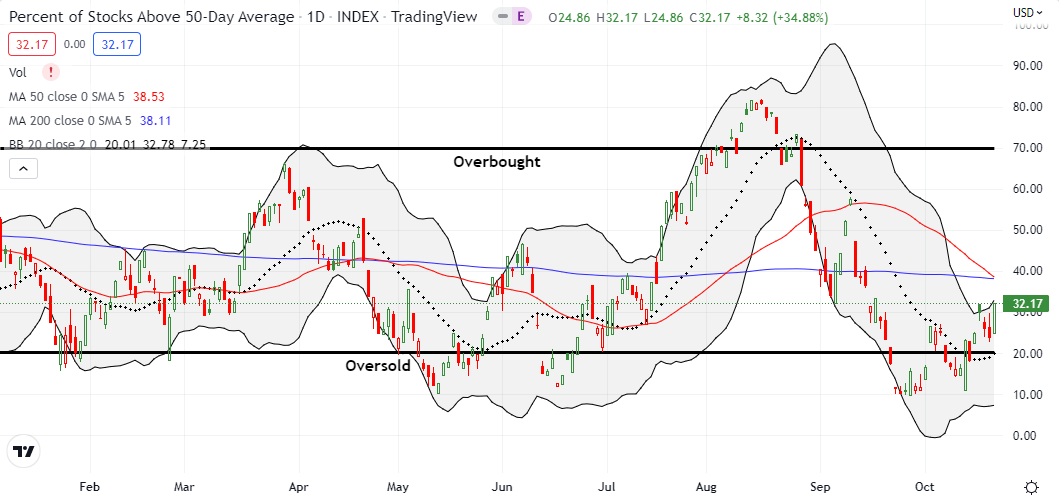
- AT50 (MMFI) = 32.2% of stocks are trading above their respective 50-day moving averages
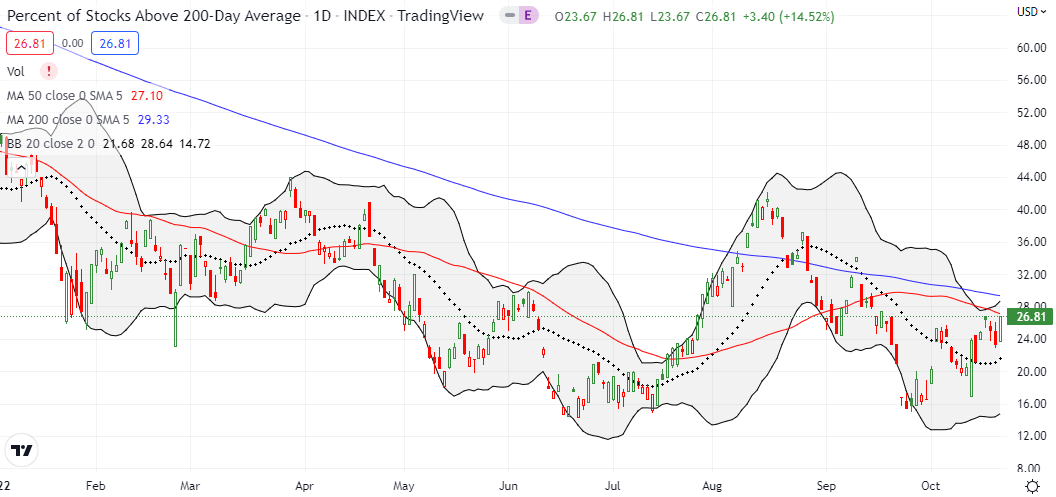
- AT200 (MMTH) = 26.8% of stocks are trading above their respective 200-day moving averages
- Short-term Trading Call: bullish
AT50 (MMFI), the percentage of stocks trading above their respective 50DMAs, closed at 32.2%. My favorite technical indicator capped a relatively bullish week by trading above oversold territory for the entire week. This streak last happened in early September as the market descended toward and then into oversold conditions. Moving the downtrending 20DMA from resistance to support, pushed my short-term trading call from cautiously bullish and back to bullish. Given the confirmation of the bottom from the bullish engulfing pattern, I expect to stay bullish until at least the next encounter with overbought trading conditions.
The transition from resistance to support kept me more active than usual with trades. On Tuesday’s 20DMA breakout for the S&P 500, I jumped into a SPY Nov 04/18 $380 calendar call spread and a QQQ Oct 21/28 $280 calendar call spread. I ended the week limiting losses from my long standing short SPY 375/365 put spread only to see the day close with my thesis proven out with that spread crushed to near zero. I created a pairs trade with SPY by adding TLT Nov 04 $96 puts. (More on the TLT side of the trade below.) Finally, I took profits on both an IWM call option and a calendar call spread (that action reminded me why I like this setup during times of churn) and rolled into an IWM Nov 04/11 $175 calendar call spread.
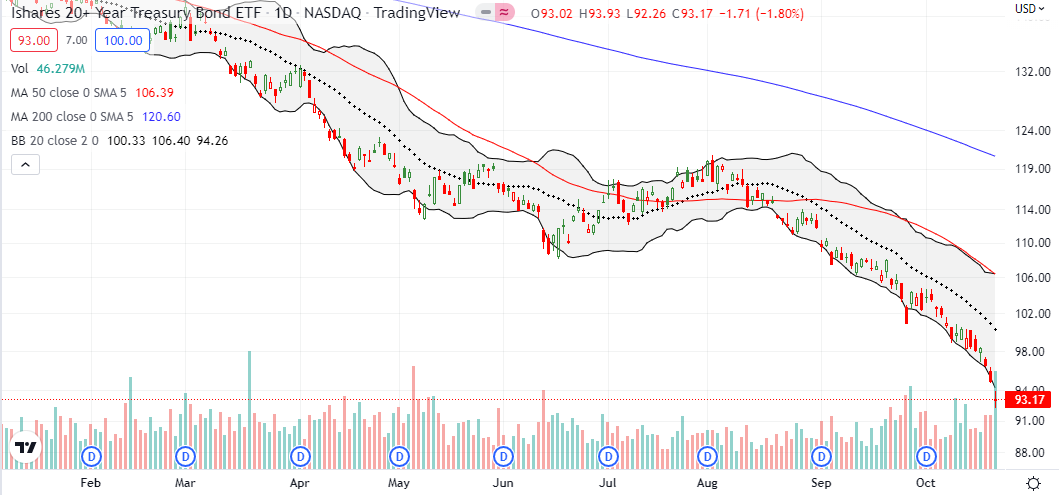
Until last week, the persistent increase in interest rates acted like a weight around the ankles of the stock market. Surprisingly, I rarely thought to play this downtrend. When I finally did so last week, I included TLT puts in a pairs trade going long SPY calls. In two days, TLT sold off enough to motivate me to take early profits even as I braced for the results of the S&P 500’s test of 20DMA support. The very next day, TLT plunged another 1.8% while the stock market rallied. The combination of TLT getting overstretched to the downside well below its lower Bollinger Band (BB) with the stock market’s stubborn counter rally suggests a fundamental change in market technicals. I of course favor a bullish interpretation of the sudden divergence.
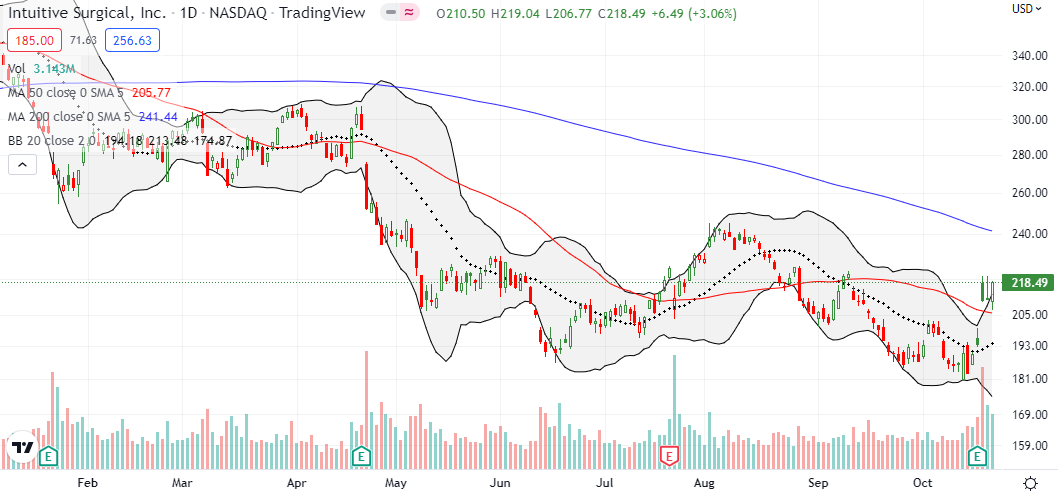
I have my eye on Intuitive Surgical, Inc (ISRG). The stock surged 9.0% post-earnings, yet faded off its intraday high. Still, buyers managed to keep ISRG trading above its 50DMA with a close for the week at the September high. Even with a downtrending 200DMA (the blue line) looming, a higher close for ISRG makes me a buyer.
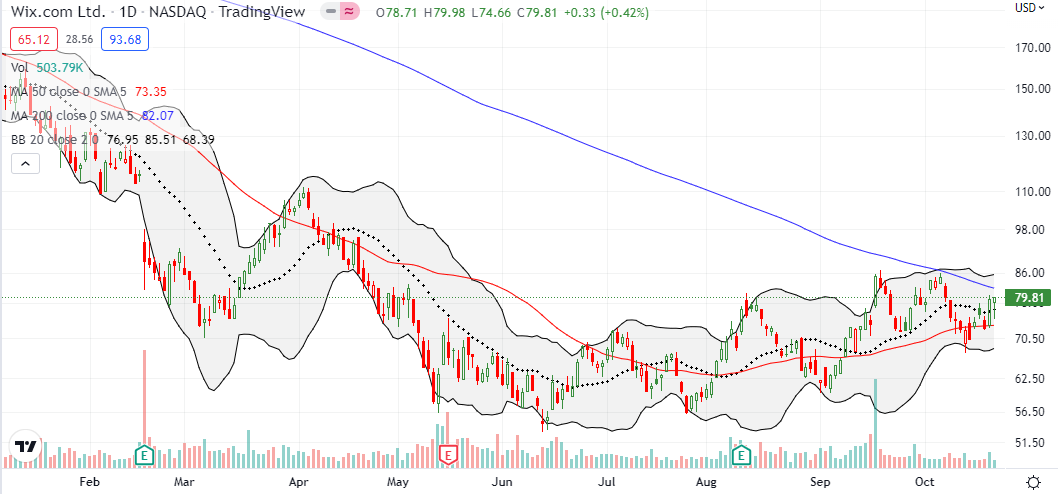
Wix.com Ltd (WIX) caught my attention after the web publishing company announced a $300M stock buyback. WIX promptly rallied 9.3% off 50DMA support (the read line below). This news comes in the wake of an impressive out-performance in September where WIX managed to GAIN 23.6%. The resulting technical action is creating a base of support for WIX and makes a 200DMA breakout increasingly likely. I am a buyer after two higher closes above the 200DMA.
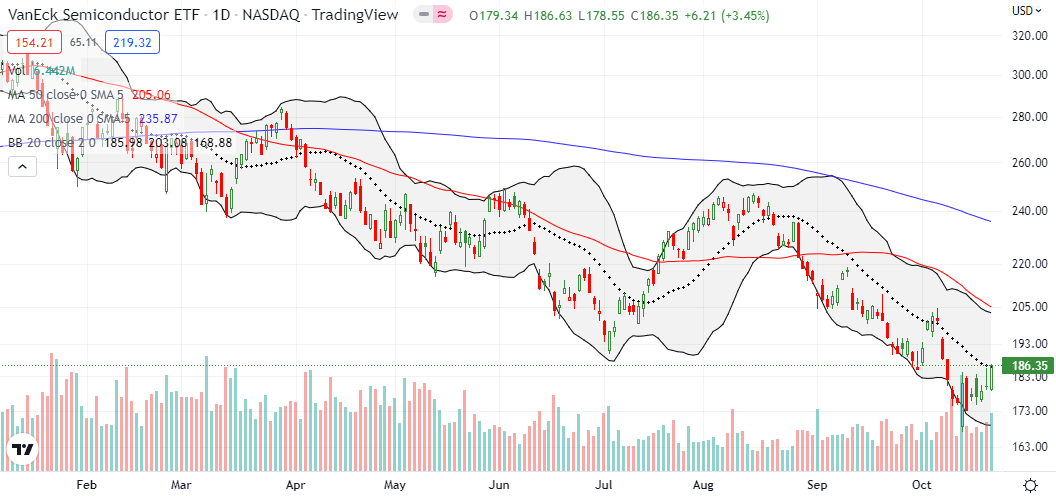
Per an earlier post, I now treat the VanEck Semiconductor ETF (SMH) as a good hedge against bullishness. Earlier in the week, I took profits on my last SMH put position. I rolled into a fresh calendar put, a SMH Oct 28 ’22 $170 and Nov 04 ’22 $172, when SMH challenged its 20DMA. Note well that Friday’s rally failed to punch through 20DMA resistance. Still, I expect the short side of the spread to expire worthless and give me some kind of better hedge for the first week of November.
Be careful out there!
Footnotes
“Above the 50” (AT50) uses the percentage of stocks trading above their respective 50-day moving averages (DMAs) to measure breadth in the stock market. Breadth defines the distribution of participation in a rally or sell-off. As a result, AT50 identifies extremes in market sentiment that are likely to reverse. Above the 50 is my alternative name for “MMFI” which is a symbol TradingView.com and other chart vendors use for this breadth indicator. Learn more about AT50 on my Market Breadth Resource Page. AT200, or MMTH, measures the percentage of stocks trading above their respective 200DMAs.
Active AT50 (MMFI) periods: Day #5 over 20%, Day #1 over 30% (overperiod ending 23 days under 30%), Day #29 under 40%, Day #31 under 50%, Day #39 under 60%, Day #40 under 70%
Source for charts unless otherwise noted: TradingView.com
Full disclosure: long IWM calendar call spread, long SPY calendar call spread, long SMH calendar put (diagonal) spread, long QQQ calendar call spread
FOLLOW Dr. Duru’s commentary on financial markets via StockTwits, Twitter, and even Instagram!
*Charting notes: Stock prices are not adjusted for dividends. Candlestick charts use hollow bodies: open candles indicate a close higher than the open, filled candles indicate an open higher than the close.


