
Fed Waffling and Trade War Expansion Reject Market from Overbought – Above the 40 (August 1, 2019)
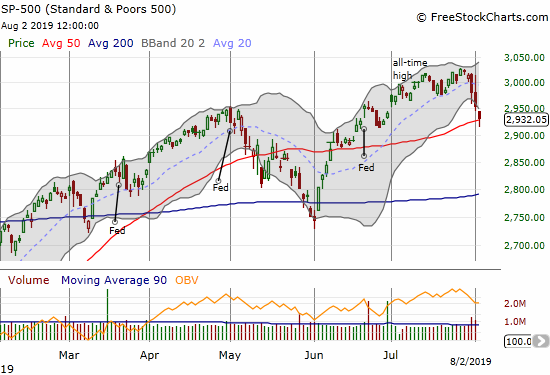
AT40 = 41.5% of stocks are trading above their respective 40-day moving averages (DMAs) AT200 = 49.8% of stocks are trading above their respective 200DMAs VIX = 17.6 (high of 20.1)Short-term Trading Call: neutral Stock Market Commentary A Pause of Recognition I am writing about financial markets at a time when there is renewed pain … Read more