
AT40 = 64.0% of stocks are trading above their respective 40-day moving averages (DMAs)
AT200 = 53.5% of stocks are trading above their respective 200DMAs
VIX = 12.3
Short-term Trading Call: neutral (change from bearish)
Stock Market Commentary
It was one of those amazing endings. First round of the NBA playoffs. The Portland Trailblazers up 3 games to 1, tied 115-115 against the Oklahoma City Thunder with seconds to go in Portland. Damian Lillard was surprisingly content to just dribble in front of defender Paul George near the half court line as the seconds melted off the clock. With about two seconds to go, Lillard made a “step back” move and launched the ball in the air. Basket. Thee Points. Portland won the game and the series. On to the second round of the playoffs.
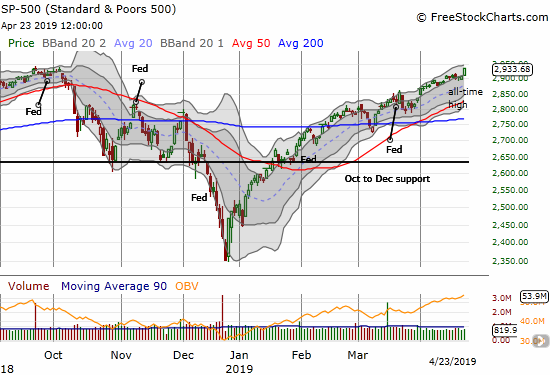
After looking exhausted and straining against bearish divergences, the stock market launched itself into a broad-based rally and new all-time highs for the S&P 500 (SPY) and the NASDAQ (NDX). Just like Lillard, the market’s victory followed a steady dribble that lulled the defense (the sellers) to sleep. The S&P 500 made a three-point play: a jump from the bottom of its upper Bollinger Band (BB), a close at its intraday high, and the first all-time high since September, 2018.
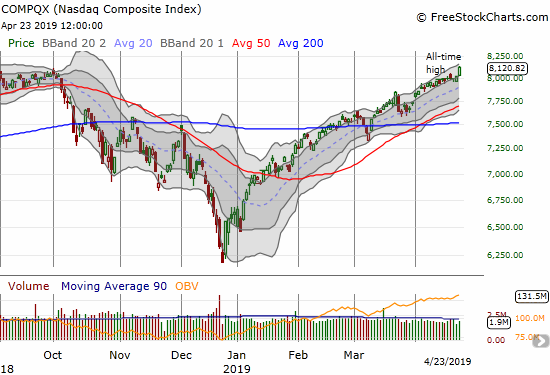
The NASDAQ (NDX) woke up alongside the S&P 500 (SPY).
AT40 (T2108), the percentage of stocks trading above their respective 40-day moving averages (DMAs), confirmed the broad-based nature of the rally by jumping from 56.5% (and another mild bearish divergence) to 64.0%. While I wanted to wait until my favorite technical indicator flipped to overbought (over 70%) before changing my short-term trading call to neutral, the all-time highs forced my hand. Since there is no natural resistance after an all-time high, it makes no sense to stick with a bearish short-term trading call. There is no need to flip bearish from here until/unless the S&P 500 closes below 2900 which would reverse today’s breakout. This lower bound can go higher with the stock market.
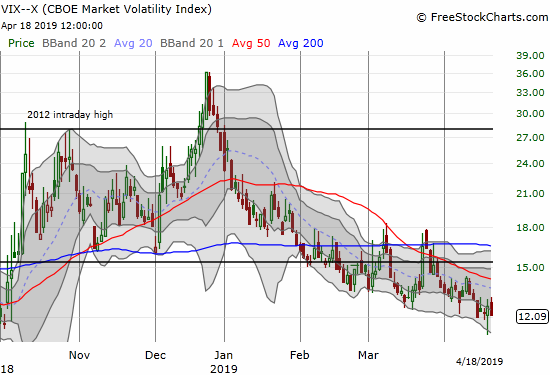
Surprisingly, the volatility index, the VIX, did not plunge into deeper levels of complacency. The VIX did not even break the 12 level. This surprising resiliency motivated me to double down on my call options on the Ultra VIX Short-Term Futures ETF (UVXY) .
Bearish Divergence
Another surprise came from the currency market. The Australian dollar (FXA), the classic risk-on currency, peaked last week against all major currencies. In particular, the 200DMA breakout against the Japanese yen (AUD/JPY) came to a quick end. Tonight’s exceptionally low inflation report for Australia sealed the deal. AUD/JPY now takes on the mantle of bearish divergence with the stock market.
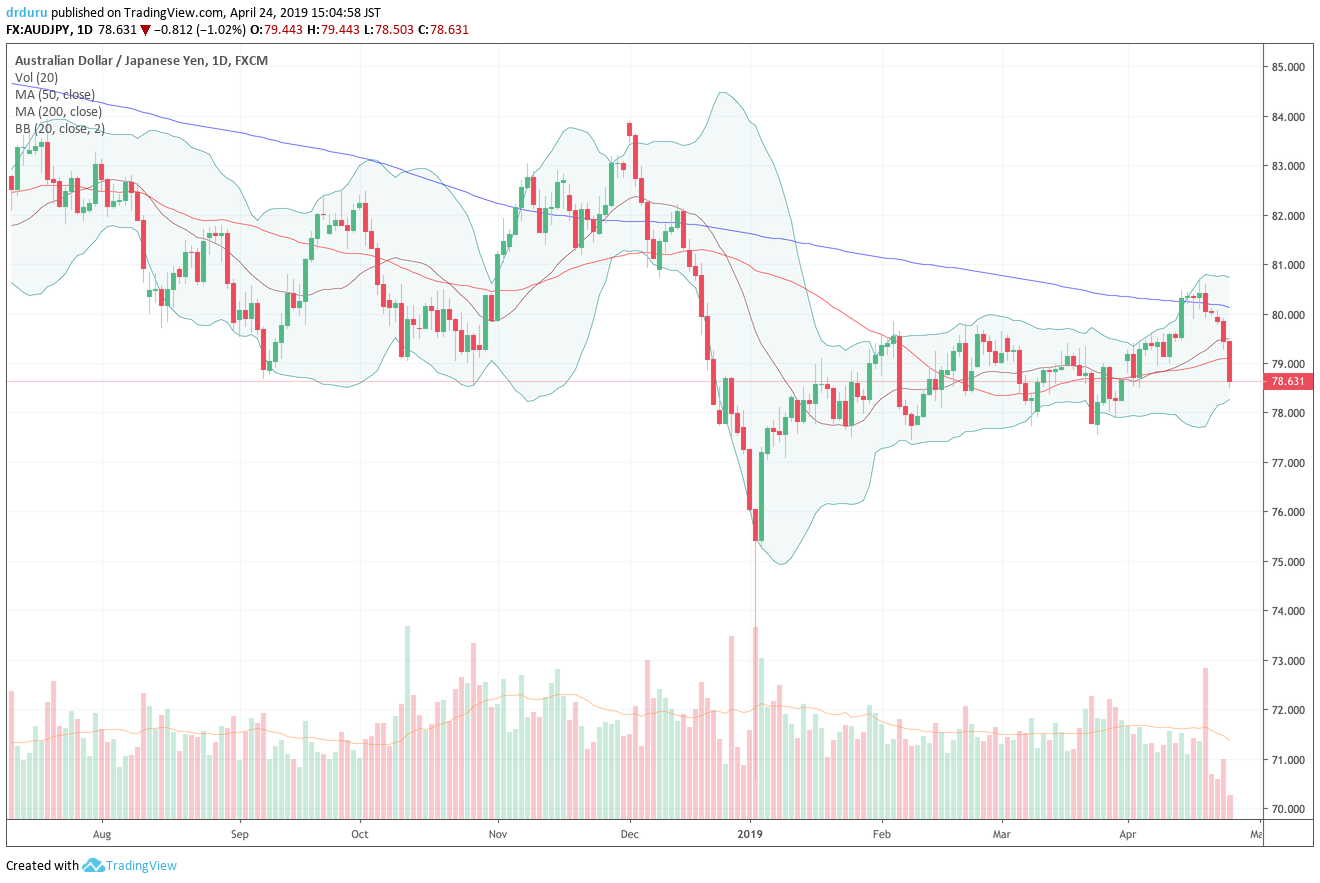
Source: TradingView
I was buying into this decline as a hedge on my bearishness. I got a bit more aggressive into tonight’s decline. If the market’s bullish mood continues, I expect AUD/JPY to find support around the bottom of its previous trading range. Regardless, this bearish divergence is sufficient to maintain my low expectations for the stock market in the coming weeks. (For more on the importance of AUD/JPY as a market indicator, see “Why the Australian Dollar and Japanese Yen Matter for Stock Traders“).
Here is yet one more oddity about the day’s rally: the NASDAQ somehow managed to print more 52-week lows than 52-week highs….
Recession No More
At the end of March, I discussed the prospects of an imminent recession given the U.S. administration’s scramble to strip the Federal Reserve of its independence. The market’s rally is facilitating reassurances that the odds of a recession are once again very remote.
Stock Chart Reviews – Bullish
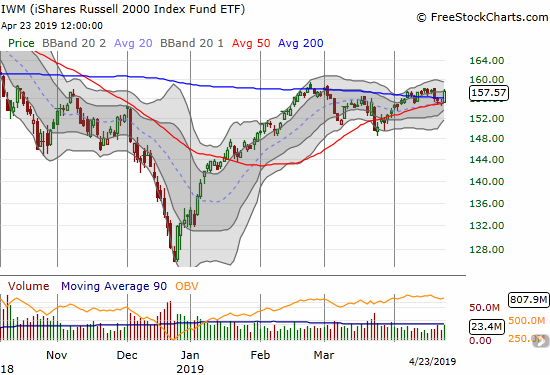
iShares Russell 2000 ETF (IWM)
I explained in my last Above the 40 post, why I was targeting call options on iShares Russell 2000 ETF (IWM) as a hedge. I loaded up right at the open on Monday and watched as the calls quickly lost value going into the close even though IWM went almost nowhere. I took the slide as a sign that a big pullback was on its way. Instead, IWM soared right back to its highs of the month and allowed me to take profits with a double. The profits almost made me feel better about my short-term trading call.
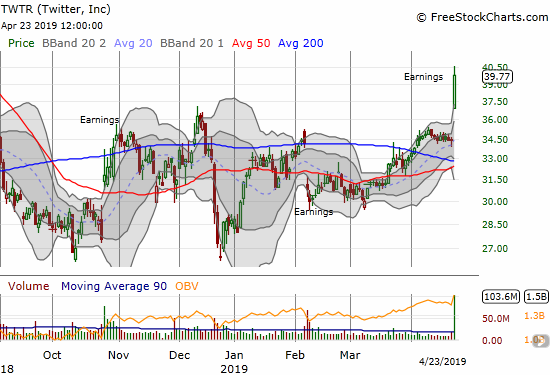
Twitter (TWTR)
When I decided to sell a covered call (May $35) against my Twitter (TWTR) shares, I definitely did not anticipate post-earnings fireworks. Even with profits locked in, it will be hard to watch my shares get called away!
Stock Chart Reviews – Bearish
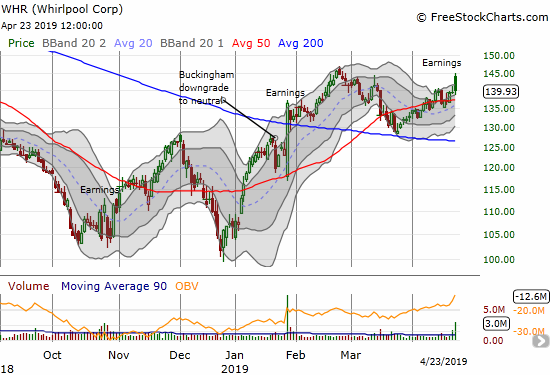
Whirlpool (WHR)
It is never good for a stock to display bearish behavior on a big market rally day. Whirpool (WHR) initially gapped higher in response to its earnings report, but I assume investors were underwhelmed with the conference call. The stock almost closed flat by the end of the day. I expect WHR to eventually test 200DMA support after it makes one more post-earnings closing low.
— – —
FOLLOW Dr. Duru’s commentary on financial markets via email, StockTwits, Twitter, and even Instagram!
“Above the 40” uses the percentage of stocks trading above their respective 40-day moving averages (DMAs) to assess the technical health of the stock market and to identify extremes in market sentiment that are likely to reverse. Abbreviated as AT40, Above the 40 is an alternative label for “T2108” which was created by Worden. Learn more about T2108 on my T2108 Resource Page. AT200, or T2107, measures the percentage of stocks trading above their respective 200DMAs.
Active AT40 (T2108) periods: Day #75 over 20%, Day #73 over 30%, Day #72 over 40%, Day #17 over 50%, Day #1 over 60% (overperiod ending 3 days under 60%), Day #34 under 70%
Daily AT40 (T2108)
")
Black line: AT40 (T2108) (% measured on the right)
Red line: Overbought threshold (70%); Blue line: Oversold threshold (20%)
Weekly AT40 (T2108)

*All charts created using FreeStockCharts unless otherwise stated
The T2108 charts above are my LATEST updates independent of the date of this given AT40 post. For my latest AT40 post click here.
Related links:
The AT40 (T2108) Resource Page
You can follow real-time T2108 commentary on twitter using the #T2108 or #AT40 hashtags. T2108-related trades and other trades are occasionally posted on twitter using the #120trade hashtag.
Be careful out there!
Full disclosure: long UVXY calls, long AUD/JPY, long TWTR and short a call option,
*Charting notes: FreeStockCharts stock prices are not adjusted for dividends. TradingView.com charts for currencies use Tokyo time as the start of the forex trading day. FreeStockCharts currency charts are based on Eastern U.S. time to define the trading day.