
AT40 = 41.5% of stocks are trading above their respective 40-day moving averages (DMAs)
AT200 = 49.8% of stocks are trading above their respective 200DMAs
VIX = 17.6 (high of 20.1)
Short-term Trading Call: neutral
Stock Market Commentary
A Pause of Recognition
I am writing about financial markets at a time when there is renewed pain and fear in America from gun violence and mass shootings. I fully recognize the suffering of the many victims (and unfortunately future victims) is monumentally more important than anything I write here.
Volatility Surge
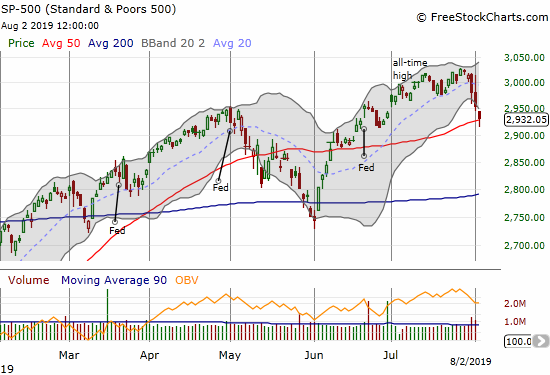
When the S&P 500 (SPY) made an all-time high three weeks ago, the stock market looked poised to cross into overbought conditions. Instead, the stock market and AT40 (T2108), the percentage of stocks trading above their respective 40-day moving averages (DMAs), stalled out. When the S&P 500 made a new marginal all-time high a week ago, AT40 had fallen from 68.2% to 63.0% over those two weeks. This was a subtle bearish divergence and not strong enough to make a good risk/reward bet shorting the market ahead of the Federal Reserve’s next decision on monetary policy.
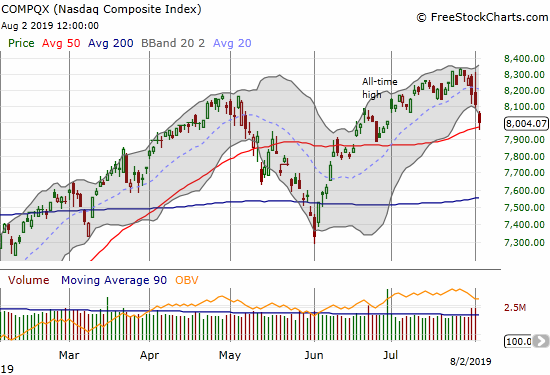
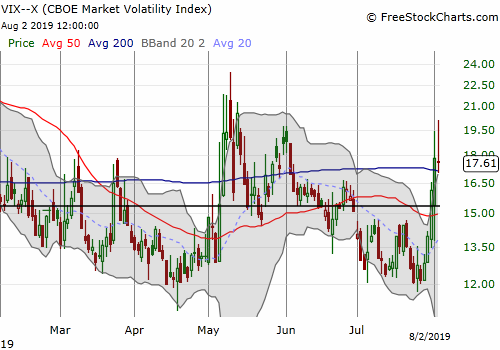
Still, as I noted and explained 2 weeks ago, I wanted to be long volatility just ahead of the Fed meeting. The stock market was extremely optimistic about rate cuts going into that meeting and an upside surprise from the Fed seemed unlikely. Not only did the Fed deliver a volatility-inducing performance, but also President Trump piled on with an expansion of his Trade War against China. Both the S&P 500 (SPY) and the NASDAQ (COMPQX) are suddenly back at 50DMA support. The volatility index (VIX) tagged the important 20 level which conventionally marks “high” volatility. I took profits on my call options on Ultra VIX Short-Term Futures ETF (UVXY) into the volatility spike. I used the pullback of volatility into Friday’s close to buy a Aug 16 $35/40 call spread (the options now look very expensive, so I do not want to buy them outright).
More Rate Cut Drama
The statement on monetary policy did not contain a compelling rationale for a rate cut. The Fed provided reassurances on the U.S. economy with the exception of “soft” business fixed investment and inflation under the 2% target, hardly the appearance of urgency that usually accompanies rate cuts.
“Information received since the Federal Open Market Committee met in June indicates that the labor market remains strong and that economic activity has been rising at a moderate rate. Job gains have been solid, on average, in recent months, and the unemployment rate has remained low. Although growth of household spending has picked up from earlier in the year, growth of business fixed investment has been soft. On a 12-month basis, overall inflation and inflation for items other than food and energy are running below 2 percent.”
The predicate to the rate cut statement was the most convincing part of the explanation: “In light of the implications of global developments for the economic outlook as well as muted inflation pressures, the Committee decided to lower the target range for the federal funds rate to 2 to 2-1/4 percent.” Still, the statement provided absolutely zero details on “global developments” and why we should worry about them. The details came in the accompanying press conference which was just short of a disaster.
I watched the entire press conference. Chairman Jerome Powell truly struggled to explain the rationale for the rate cut and the Fed’s go-forward plan. The waffling was most evident when members of the press corp pushed and pushed on Powell for answers and more clarity. For example, when asked for the meaning of a “mid-cycle adjustment in policy” Powell could only offer the following:
“Well, the sense of that is, I mean that refers back to other times when the FOMC has cut rates in the middle of a cycle. I’m contrasting it there with the beginning, for example, the beginning of a lengthy cutting cycle.”
This explanation disappointed market participants and helped send stocks downward. Powell was later pressed further on the number of rate cuts the market should expect. He then had to backtrack on appearing to slam the door on the potential for further cuts.
“No, let me be clear. What I said was it’s not, it’s not the beginning of a long series of rate cuts. I didn’t say it was just one or anything like that. What I said is, when you think about rate-cutting cycles, they go on for a long time, and the Committee is not seeing that, not seeing us in that place. You would do that if you saw real economic weakness and you thought that the federal funds rate needed to be cut a lot. That’s not what we’re seeing. That’s not what we’re seeing.
What we’re seeing is that it’s appropriate to adjust policy to a somewhat more accommodative stance over time, and that’s how we’re looking at it. What I said was it’s not a long cutting cycle, in other words referring to what we do when there’s a recession or a very severe downturn. That’s really what I was ruling out. I think if you look back at other midcycle adjustments you’ll see, you know, I don’t know that they’ll be in the end comparable or not, but you’ll see examples of these.
At least Powell clarified that the Fed is not expecting a recession (the Fed NEVER predicts a recession anyway). Unfortunately, Powell concerned the market enough that long-term bond yields dropped, and the stock market kept declining. Powell is also fighting a definitive historical relationship: soon after rate hikes reach a peak during a cycle, a recession tends to occur. Only one recession since 1967 failed to follow this relationship. In other words, financial markets are right to be concerned about the implications of this rate cut beyond what Powell struggles to explain.
In a Marketplace interview, former Fed Gov. Daniel Tarullo described the difficulty facing the Fed in communicating policy at this juncture. He guessed that little effort went into explaining the rate cut and more effort was spent on explaining the go-forward plan.
Market Rate Expectations
Two Fed governors added a surprising twist to this drama in dissenting against the rate cut. Eric S. Rosengren even explained his dissent in a revealing press release:
“With the unemployment rate near 50-year lows and inflation likely to rise toward the 2 percent target, and with financial stability concerns being somewhat elevated given near-record equity prices and corporate leverage, I do not see a clear and compelling case for additional monetary accommodation at this time.”
Rosengren provided eight charts that explained his dissent. Each chart included a very descriptive and argumentative title:
- The unemployment rate is near 50-year lows.
- The trimmed mean PCE inflation rate is at 2%.
- The U.S. economy is growing somewhat faster than potential.
- The cost of credit is not elevated.
- Market volatility is not elevated.
- Credit spreads are not elevated.
- Stock prices are near all-time highs.
- Corporate leverage is near an all-time high.
These points looked drawn specifically to counter Powell’s explanation for how this rate cut will accomplish the Fed’s objectives: “…our policy does support, it supports confidence, it supports economic activity, household and business confidence, and through channels that we understand. So, it will lower borrowing costs. It will, and it will work.” Rosengren is arguing that the data show no issues with confidence or borrowing.
The market’s attempt to cut through the fog placed a 50/50 bet on another rate cut coming at the September meeting. Those odds soared to 100% after Trump expanded the Trade War. Similarly, the market placed roughly 50/50 odds on a third rate cut coming at the January meeting. The Trade War escalation accelerated that timetable right to 56% odds at the October meeting (all data from CME FedWatch).
Needless to say, with the market now in its most dangerous month of the year, I am expecting volatility to remain elevated and will be looking to buy all dips in volatility.
Stock Chart Reviews – Bearish
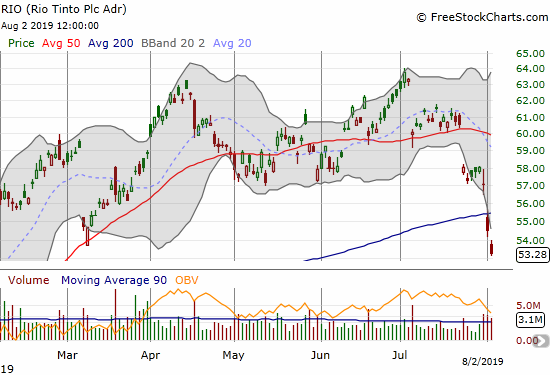
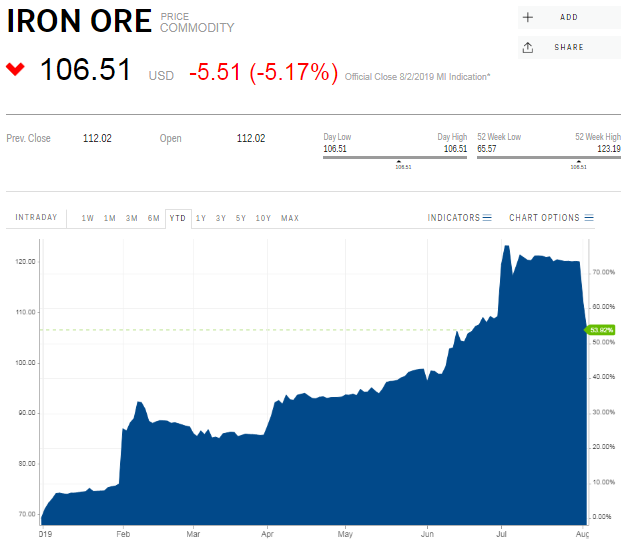
BHP Group (BHP) and Rio Tinto (RIO)
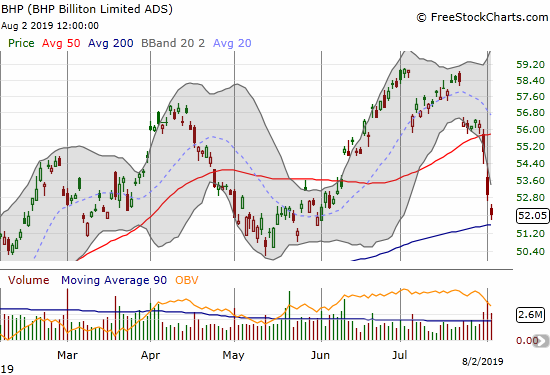
A week ago, I concluded that iron ore looked toppy. I took profits on my put options on Rio Tinto (RIO) and left the call options in BHP Group (BHP) in place. The last three days forced iron ore and related trades into a steep sell-off and created conditions ripe for a fresh pairs trade (of course I wish I held my RIO puts even longer!). I loaded up on BHP Nov $55 call options and RIO Oct 18 $50 put options. I am leaning toward a relief rally unfolding within the next two months or so, especially with BHP at 200DMA support. A continuation of selling pressure should take RIO and BHP a LOT lower.
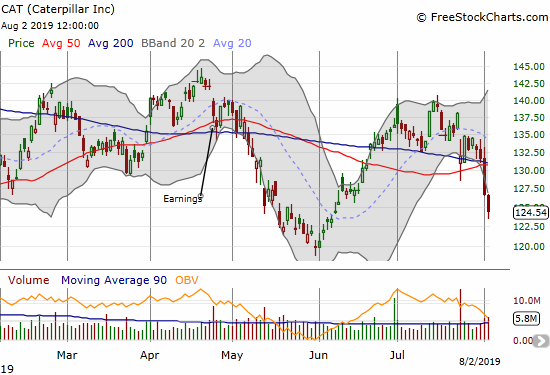
Caterpillar (CAT)
As Caterpillar (CAT) dribbled along its 200DMA support ahead of July earnings, I thought the stock was setting up bears for a major surprise. Instead, CAT gapped back down to 200DMA support after earnings and last week’s selling pressed the stock into a bearish breakdown. Instinctively, I went after CAT put options in the wake of the Fed’s bungled meeting. I took profits in Thursday’s selling. CAT is back on the top of my list as a stock to fade in rallies.
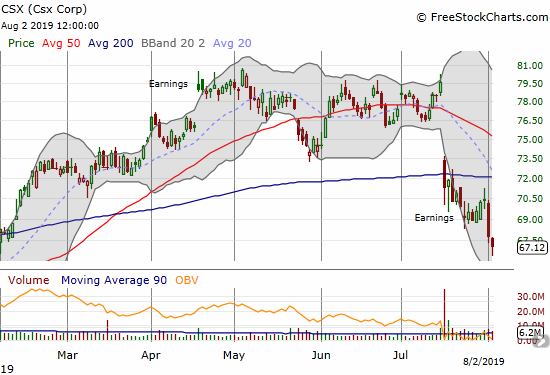
Csx Corp (CSX)
I thought stocks like Csx Corp (CSX) would find new life with a dovish Federal Reserve. CSX did manage to outperform the market and clung to a marginal gain in the wake of the Fed announcement. The escalation of the Trade War proved too much a burden. The stock sold off to a new 6-month low.
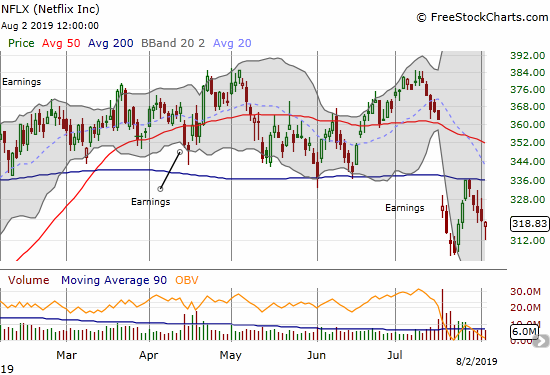
Netflix (NFLX)
Netflix (NFLX) gapped its way to a post-earnings 200DMA breakdown. The 200DMA held as resistance. I missed that entry point, but I used NFLX’s bounce off Friday’s intraday low to initiate an August $310/300 put spread.
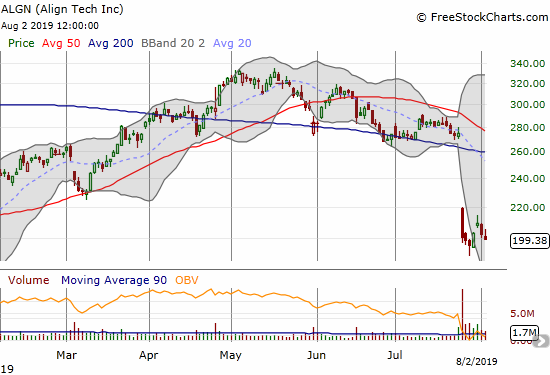
Align Tech (ALGN)
Align Technology (ALGN) suffered a disastrous post-earnings gap down. This kind of loss usually takes months and even quarters to reverse and often is the beginning of a secular decline. Still, ALGN looked like a relief rally candidate after the stock printed a hammer at its post-earnings low. That bounce lasted just two days. Thanks to general market weakness, the stock looks ready to make fresh post-earnings lows already. I am keeping an eye on the stock since the CEO blamed China for the shortfall and claimed the business still looks good.
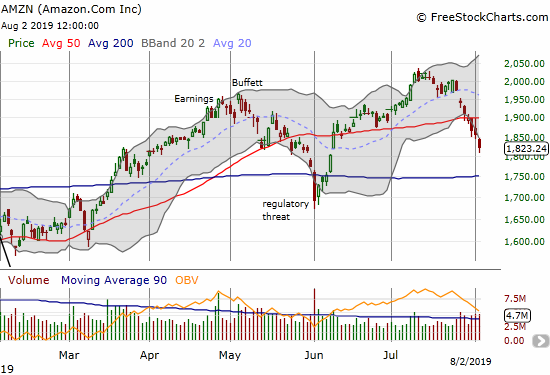
Amazon.com (AMZN)
It is so hard to bet against Amazon.com (AMZN). Yet here it is with a 50DMA breakdown that is part of on-going post-earnings selling. The stock looks poised for an eventual retest of 200DMA support.
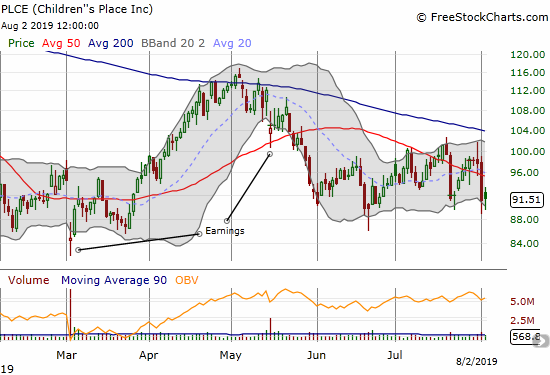
Children’s Place (PLCE)
While I look for excuses to buy Children’s Place (PLCE), I have to acknowledge it acts bearishly. The stock keeps failing at overhead resistance levels. The upside potential of playing the bottom of the trading range is shortening ever so gradually as both 50 and 200DMAs are in decline.
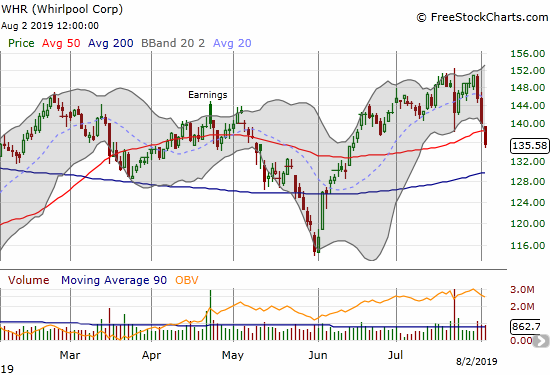
Whirlpool (WHR)
Whirlpool (WHR) is bearish because of its 50DMA breakdown on Friday. I would not chase this stock downward because of the rising 200DMA support. A fade on a rally into 50DMA resistance would make for a better risk/reward.
Stock Chart Reviews – Bullish
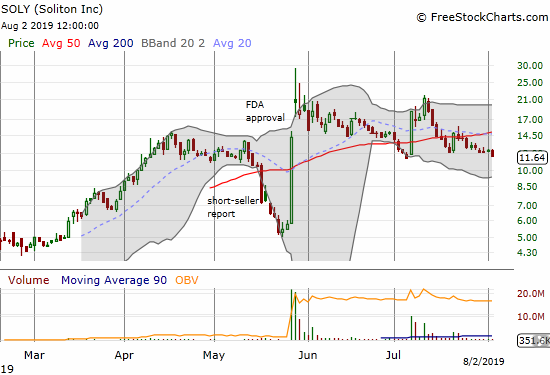
Soliton (SOLY)
Despite a series of press releases and product news, I do not think the underlying story or trade in Soliton (SOLY) has changed. The stock failed to hold 50DMA support, but I am still looking for a new entry point. It would take a full reversal of the rally after the FDA approval to make me bearish.
Sellers have done their best to reverse the big rally on July 8th when the company announced the date for the release of cellulite trial results. Predictably, investors and traders used the release of those results on July 15th as an opportunity to sell. Buyers have largely failed to show up since then. (Some unsolicited advice to Soliton: do not announce dates for announcements unless they are earnings results – speaking of which, I am patiently awaiting a date for an earnings report).
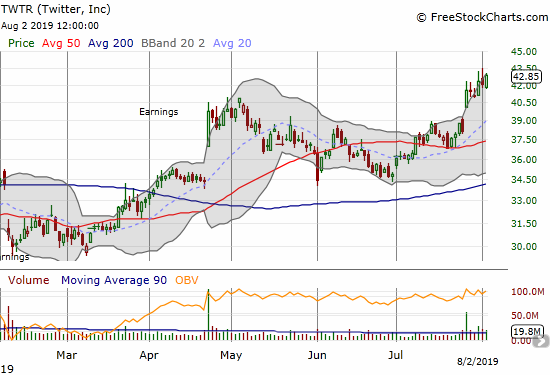
Twitter (TWTR)
Twitter (TWTR) is somehow pressing through market weakness thanks to a strong post-earnings response (the most recent gap up in the chart below). As a Twitter bull with no position, I was actually disappointed the stock failed to dip after earnings. I will have to keep waiting for an ideal re-entry point…
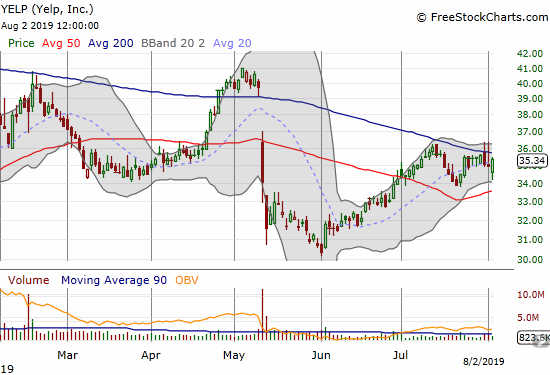
Yelp (YELP)
I put Yelp (YELP) in the bullish section because I am looking for an entry point to buy. The stock is still trying to recover from a disastrous earnings report in May. I need to be wary about the next earnings report since the stock keeps banging against 200DMA resistance. Still, YELP is interesting as it holds onto a trading range in place since a very disastrous earnings announcement last November. This year’s low successfully tested that November low.
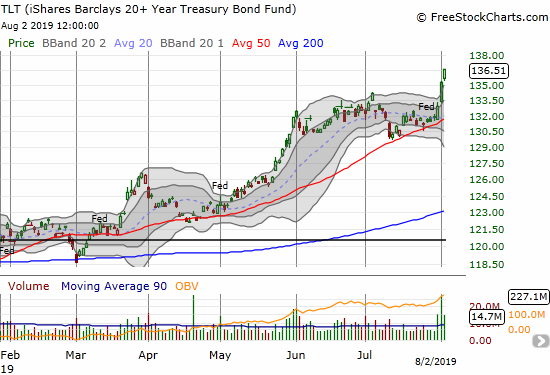
iShares Barclays 20+ Year Treasury Bond Fund (TLT)
With financial markets pricing in a rapid rate cutting cycle alongside economic problems from the expanded Trade War, long-term bonds soared (yields plunged). The iShares Barclays 20+ Year Treasury Bond Fund (TLT) went straight up the last 3 days. The flight to safety looks a bit extreme now, so I refreshed my position in TLT put options.
— – —
FOLLOW Dr. Duru’s commentary on financial markets via email, StockTwits, Twitter, and even Instagram!
“Above the 40” uses the percentage of stocks trading above their respective 40-day moving averages (DMAs) to assess the technical health of the stock market and to identify extremes in market sentiment that are likely to reverse. Abbreviated as AT40, Above the 40 is an alternative label for “T2108” which was created by Worden. Learn more about T2108 on my T2108 Resource Page. AT200, or T2107, measures the percentage of stocks trading above their respective 200DMAs.
Active AT40 (T2108) periods: Day #144 over 20%, Day #44 over 30%, Day #37 over 40% (overperiod), Day #2 under 50% (underperiod), Day #11 under 60%, Day #101 under 70%
Daily AT40 (T2108)
")
Black line: AT40 (T2108) (% measured on the right)
Red line: Overbought threshold (70%); Blue line: Oversold threshold (20%)
Weekly AT40 (T2108)

*All charts created using FreeStockCharts unless otherwise stated
The T2108 charts above are my LATEST updates independent of the date of this given AT40 post. For my latest AT40 post click here.
Be careful out there!
Full disclosure: long long TLT puts, long NFLX put spread, long BHP calls, long RIO puts, long CSX calls, long UVXY call spread
*Charting notes: FreeStockCharts stock prices are not adjusted for dividends. TradingView.com charts for currencies use Tokyo time as the start of the forex trading day. FreeStockCharts currency charts are based on Eastern U.S. time to define the trading day.