A Resilient Stock Market Barely Blinks At Fresh Bearish Signals – Above the 40 (January 3, 2020)

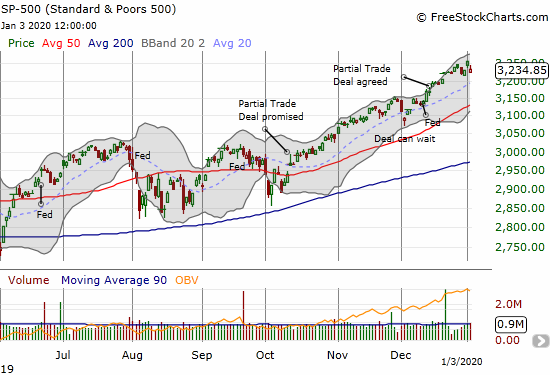
The S&P 500 (SPY) lost 0.7% and closed right at the lower boundary of its upper Bollinger Band. The pattern left behind an island reversal.

AT40 = 63.5% of stocks are trading above their respective 40-day moving averages (DMAs)AT200 = 60.3% of stocks are trading above their respective 200DMAsVIX = 14.0Short-term Trading Call: neutral Stock Market Commentary The stock market started the new decade with wild swings. After starting the first trading day of the decade with a 0.8% gain … Read more

A Book-Ends Kind of Week for Stocks (Above the 40) – December 6, 2019

AT40 = 59.3% of stocks are trading above their respective 40-day moving averages (DMAs)AT200 = 56.0% of stocks are trading above their respective 200DMAsVIX = 13.6Short-term Trading Call: neutral Stock Market Commentary Looking for buying opportunities paid off. A week that started with selling into trade troubles ended with the celebration of an exceptionally strong … Read more

A Growing Bearish Divergence Has Yet to Spoil Rally In Stock Indices – Above the 40 (November 8, 2019)

AT40 = 57.4% of stocks are trading above their respective 40-day moving averages (DMAs)AT200 = 54.9% of stocks are trading above their respective 200DMAsVIX = 12.1Short-term Trading Call: neutral Stock Market Commentary The stock market seems to be on a slow and steady march toward Christmas. The current bearish divergence and an exceptionally low volatility … Read more

A Narrowing Rally and A Sentiment Shift Define the Stock Market – Above the 40 (October 25, 2019)

AT40 = 59.4% of stocks are trading above their respective 40-day moving averages (DMAs)AT200 = 53.1% of stocks are trading above their respective 200DMAsVIX = 12.7Short-term Trading Call: neutral (see below) Stock Market Commentary A Sufficient Resolution I still harbor lingering skepticism, but the S&P 500’s recovery from the last hiccup and its subsequent slow … Read more

Stock Market Slams Into October’s Average Drawdown In Two Days Flat – Above the 40 (October 2, 2019)

The S&P 500 (SPY) confirmed its 50DMA breakdown with a 1.8% loss, but also closed well below its lower Bollinger Band.

AT40 = 39.0% of stocks are trading above their respective 40-day moving averages (DMAs) (intraday low at 34.5%)AT200 = 45.3% of stocks are trading above their respective 200DMAsVIX = 20.6Short-term Trading Call: cautiously bearish (caveats below) Stock Market Commentary A Broad-Based Exit The selling today was so broad that even Invesco S&P 500 Low Volatility … Read more