
AT40 = 59.3% of stocks are trading above their respective 40-day moving averages (DMAs)
AT200 = 56.0% of stocks are trading above their respective 200DMAs
VIX = 13.6
Short-term Trading Call: neutral
Stock Market Commentary
Looking for buying opportunities paid off. A week that started with selling into trade troubles ended with the celebration of an exceptionally strong jobs report for November. It was a book-ends kind of week.
The routine has become remarkably consistent and tradeable: a negative trade headline sends the stock market into a funk until some positive trade headline, often just a suggestion, motivates buyers to send the market even higher than before. This latest episode had the added benefit of a truly positive catalyst in the form of the jobs report.
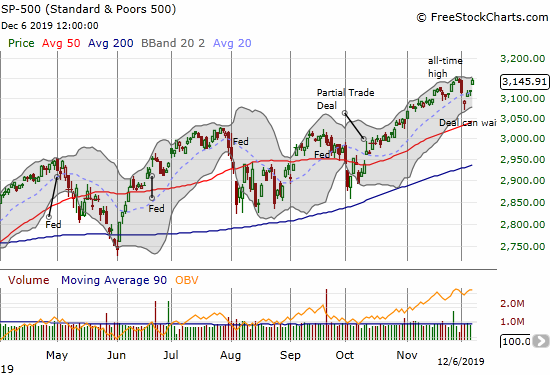
The S&P 500 (SPY) gained 0.9% to finish a complete recovery from the trade troubles that started the week. The rally confirmed the bottoming hammer that was formed when buyers first rushed into the troubling trade headlines.
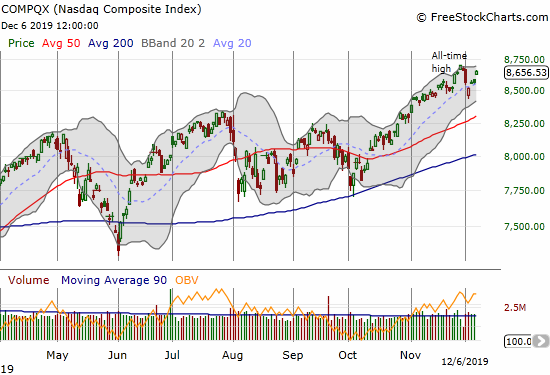
The NASDAQ (COMPQX) out-performed the S&P 500 with a 1.0% gain, but the tech-laden index did not quite recover from all its earlier losses.
AT40 (T2108), the percentage of stocks trading above their respective 40-day moving averages (DMAs), jumped from 53.0% to 59.3% in a solid confirmation of the swing in sentiment.
Volatility
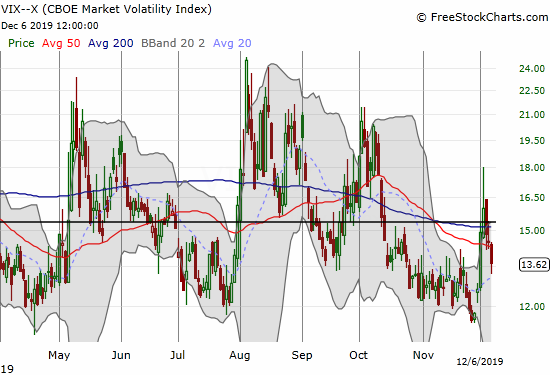
The volatility index (VIX) added its confirmation of the quick return of bullish sentiment. Volatility faders managed to push the VIX below its 15.35 pivot. However, they have not yet erased all of the VIX’s gains from the start of last week. I assume it will take a fresh wave of complacency to push the VIX back to earlier levels. The Federal Reserve’s upcoming meeting may provide just the right soothing music.
The Trading Call
In my last Above the 40 post, I explained why I considered the selling a buying opportunity. Those bets paid off although in retrospect I was still not bullish enough (thus my on-going neutral short-term trading call). That buying opportunity has transformed into a much more tenuous short-term trading ground. Chasing the rebound is fraught with the danger of sudden pullbacks.
Up next is the Federal Reserve’s latest pronouncements on monetary policy. I have no feel this time around for how the market might react under different scenarios. However, December is part of the seasonally strong period for stocks, so a Fed-related dip should be readily buyable. Recall that the trade-related selling tagged December’s historic maximum average drawdown, so I think the hammer on the S&P 500 will hold up as support against any renewed selling this month.
Stock Chart Reviews – Below the 50DMA
Deere & Co. (DE)
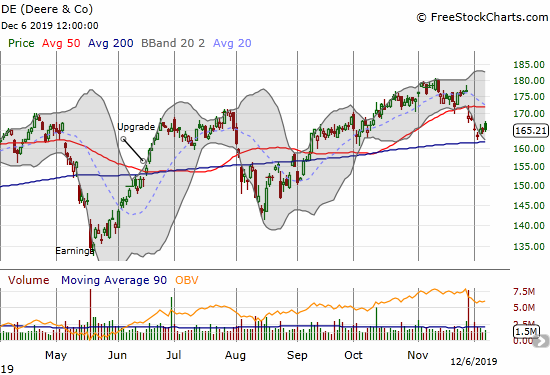
Deere & Co (DE) is one of the trade-sensitive stocks that did not manage to recover all its losses for the week. However, the confirmed test of 200DMA support looks bullish for DE.
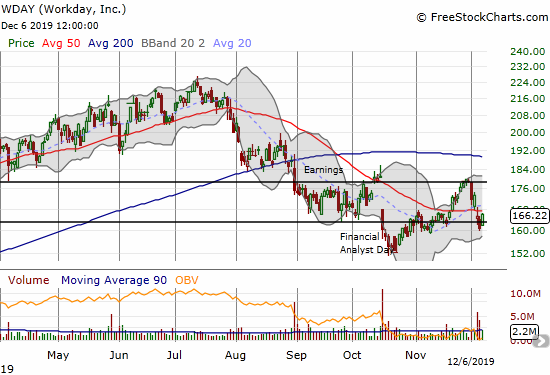
Workday (WDAY)
I thought the selling in Workday (WDAY) after its analyst meeting was a buying opportunity. Those trades eventually worked out. WDAY even came close to a full reversal of its loss. However, the stock sold off from there into earnings and kept selling after earnings. I got caught flat-footed with a hedged pre-earnings play weighted toward call options.Now WDAY looks like it wants to keep churning in the range I drew earlier.
Stock Chart Reviews – Above the 50DMA
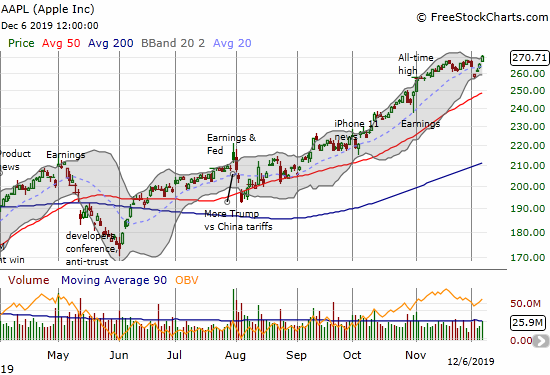
Apple (AAPL)
Apple (AAPL) was one of the trade sensitive stocks that emerged from the brief selling even stronger than before. The stock made a new all-time on Friday (label in the chart below did not shift correctly). AAPL looks ready to resume its churn higher.
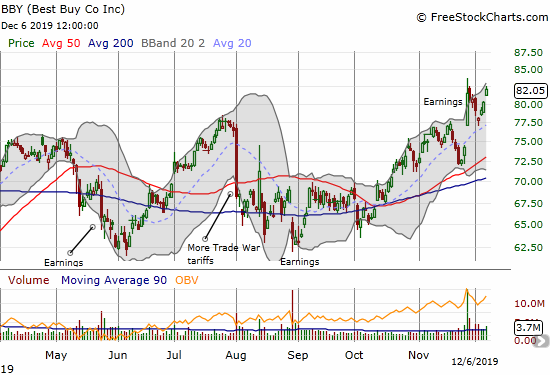
Best Buy (BBY)
Nevermind the looming December 15th date for the implementation of tariffs that will hit retail hard. Best Buy (BBY) rebounded strongly enough to set a new post-earnings high.
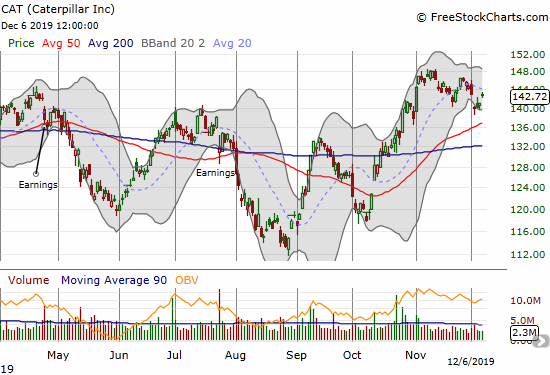
Caterpillar (CAT)
I am back to hedging against bullishness with puts on Caterpillar (CAT). I happened to be holding two handfuls at the start of the week and took profits immediately into the selling. I reloaded into the rally.
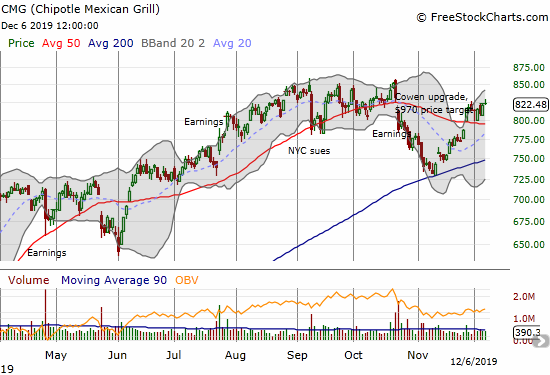
Chipotle Mexican Grill (CMG)
I am amazed Chipotle Mexican Grill (CMG) has rebounded so well from its post-earnings angst. While a full reversal remains ahead, the stock created a picture-perfect test of 200DMA support.
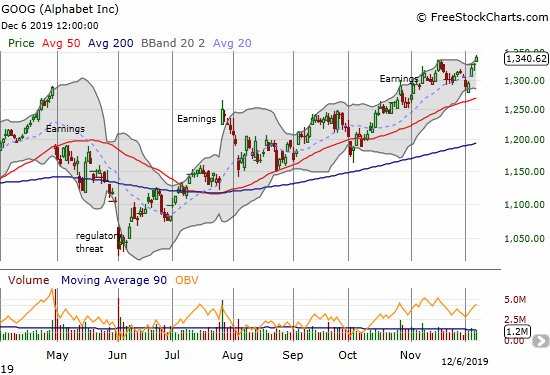
Alphabet (GOOG)
I do not think of Alphabet (GOOG) as a trade-sensitive stock, but it gapped down at the beginning of the week and ended the week stronger than before. I continue to like buying GOOG dips.
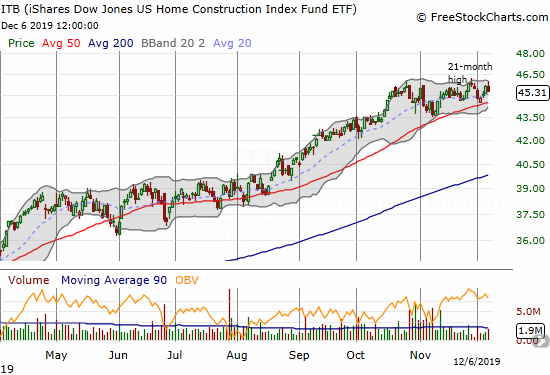
iShares US Home Construction Index Fund ETF (ITB)
The good news of Friday’s job report was bad news for iShares US Home Construction Index Fund ETF (ITB) as interest rates crept higher. ITB continues to struggle to make a strong breakout past its 21-month high. ITB under-performed the market with a 0.8% loss on Friday. The good news is that ITB continues to ride its 50DMA upward.
— – —
FOLLOW Dr. Duru’s commentary on financial markets via email, StockTwits, Twitter, and even Instagram!
“Above the 40” uses the percentage of stocks trading above their respective 40-day moving averages (DMAs) to assess the technical health of the stock market and to identify extremes in market sentiment that are likely to reverse. Abbreviated as AT40, Above the 40 is an alternative label for “T2108” which was created by Worden. Learn more about T2108 on my T2108 Resource Page. AT200, or T2107, measures the percentage of stocks trading above their respective 200DMAs.
Active AT40 (T2108) periods: Day #227 over 20%, Day #66 over 30%, Day #41 over 40%, Day #4 under 50% (overperiod), Day #14 under 60% (underperiod), Day #54 under 70%
Daily AT40 (T2108)
")
Black line: AT40 (T2108) (% measured on the right)
Red line: Overbought threshold (70%); Blue line: Oversold threshold (20%)
Weekly AT40 (T2108)

*All charts created using FreeStockCharts unless otherwise stated
The T2108 charts above are my LATEST updates independent of the date of this given AT40 post. For my latest AT40 post click here.
Be careful out there!
Full disclosure: long VIXY calls, long AAPL call spread, long WDAY calls and call spread, long CAT puts, long CMG call, long ITB call spread
*Charting notes: FreeStockCharts stock prices are not adjusted for dividends. TradingView.com charts for currencies use Tokyo time as the start of the forex trading day. FreeStockCharts currency charts are based on Eastern U.S. time to define the trading day.