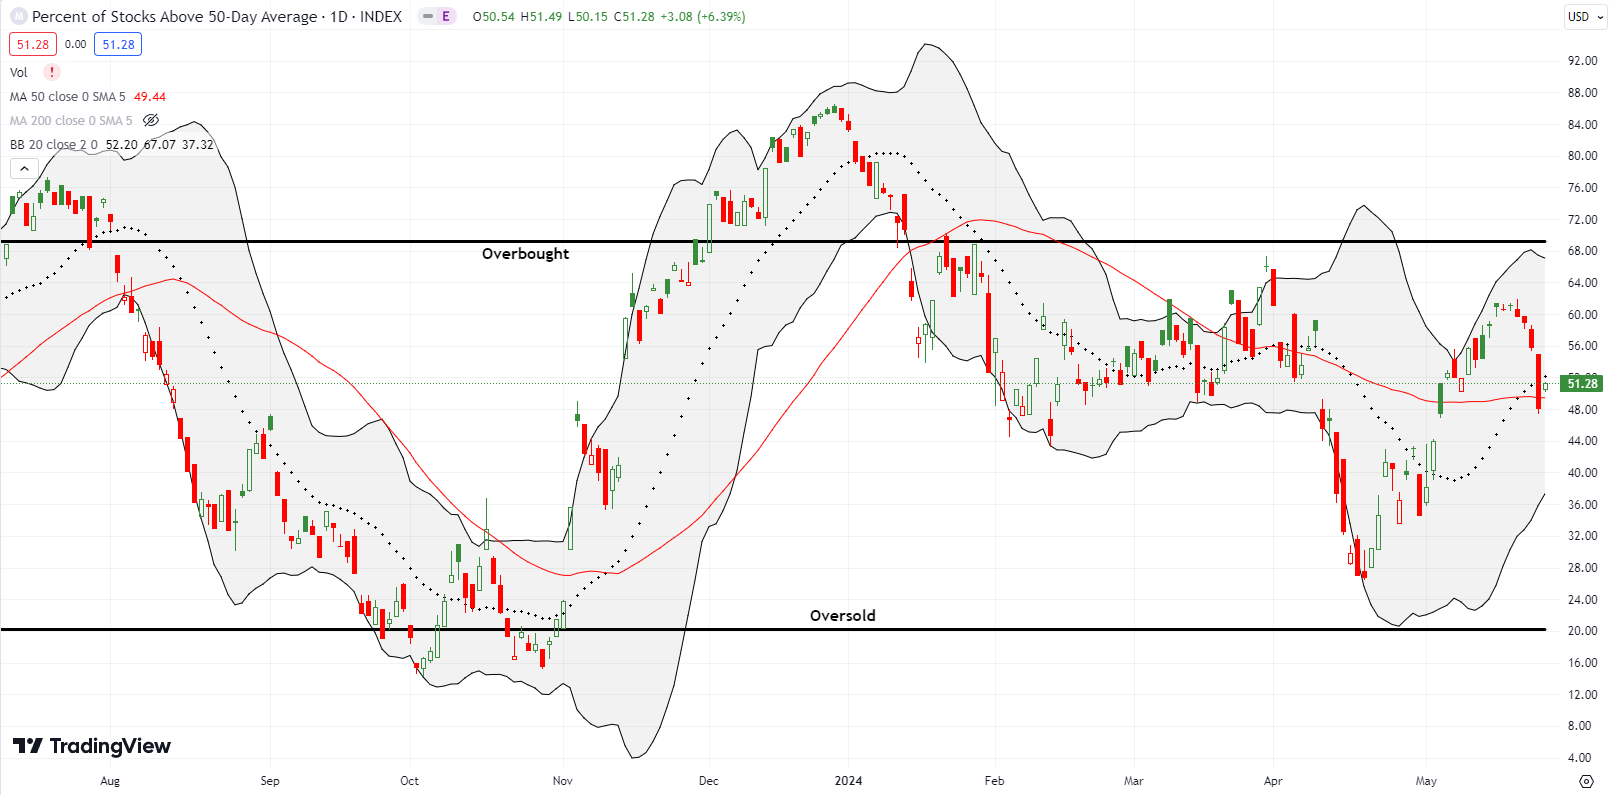
Stock Market Slams Into October’s Average Drawdown In Two Days Flat – Above the 40 (October 2, 2019)

The S&P 500 (SPY) confirmed its 50DMA breakdown with a 1.8% loss, but also closed well below its lower Bollinger Band.

AT40 = 39.0% of stocks are trading above their respective 40-day moving averages (DMAs) (intraday low at 34.5%)AT200 = 45.3% of stocks are trading above their respective 200DMAsVIX = 20.6Short-term Trading Call: cautiously bearish (caveats below) Stock Market Commentary A Broad-Based Exit The selling today was so broad that even Invesco S&P 500 Low Volatility … Read more

Small Caps Answer the Call: Overbought Trading Conditions Now Approach – Above the 40 (September 10, 2019)

The iShares Russell 2000 Index Fund ETF (IWM) has surged through 200 and 50DMA resistance in a high-volume breakout move.

AT40 = 62.1% of stocks are trading above their respective 40-day moving averages (DMAs) AT200 = 55.2% of stocks are trading above their respective 200DMAs (finished reversing all of August’s decline)VIX = 15.2Short-term Trading Call: neutral Stock Market Commentary Role reversal While the S&P 500 (SPY) and the NASDAQ (COMPQX) continue to fail at confirming … Read more

Above the 40 (November 2, 2018) – The Bounce from Oversold Survives An Early Test

AT40 = 22.0% of stocks are trading above their respective 40-day moving averages (DMAs) – ends an 11-day oversold period that followed a 4-day oversold period AT200 = 31.6% of stocks are trading above their respective 200DMAs VIX = 19.5 Short-term Trading Call: bullish Commentary If you are a long-term passive index investor, you can … Read more

T2108 Update (December 17, 2014) – Relief from Fear

(T2108 measures the percentage of stocks trading above their respective 40-day moving averages [DMAs]. It helps to identify extremes in market sentiment that are likely to reverse. To learn more about it, see my T2108 Resource Page. You can follow real-time T2108 commentary on twitter using the #T2108 hashtag. T2108-related trades and other trades are … Read more

T2108 Update (July 3, 2014) – A Surprising Overbought Divergence (Includes Trade and Chart Reviews)

(T2108 measures the percentage of stocks trading above their respective 40-day moving averages [DMAs]. It helps to identify extremes in market sentiment that are likely to reverse. To learn more about it, see my T2108 Resource Page. You can follow real-time T2108 commentary on twitter using the #T2108 hashtag. T2108-related trades and other trades are … Read more

T2108 Update (April 11, 2014) – Continuation Selling Quickly Brings Back Quasi-Oversold Conditions

(T2108 measures the percentage of stocks trading above their respective 40-day moving averages [DMAs]. It helps to identify extremes in market sentiment that are likely to reverse. To learn more about it, see my T2108 Resource Page. You can follow real-time T2108 commentary on twitter using the #T2108 hashtag. T2108-related trades and other trades are … Read more

T2108 Update (March 24, 2014) – A Day Momentum Died

(T2108 measures the percentage of stocks trading above their respective 40-day moving averages [DMAs]. It helps to identify extremes in market sentiment that are likely to reverse. To learn more about it, see my T2108 Resource Page. You can follow real-time T2108 commentary on twitter using the #T2108 hashtag. T2108-related trades and other trades are … Read more

Chart Review Madness: Bearishness Abounds

As promised, here is a cornucopia of charts. To me, this is still just a small sample of the very enticing and intriguing charts popping up everywhere as more evidence builds that some kind of top is getting printed in the stock market. In particular, note my selection of momentum charts that are wobbling, weakening, … Read more

T2108 Update (March 19, 2014) – Overbought Conditions End…Yet Again

(T2108 measures the percentage of stocks trading above their respective 40-day moving averages [DMAs]. It helps to identify extremes in market sentiment that are likely to reverse. To learn more about it, see my T2108 Resource Page. You can follow real-time T2108 commentary on twitter using the #T2108 hashtag. T2108-related trades and other trades are … Read more

T2108 Update (March 17, 2014) – Dance With Overbought Conditions Not Quite Over

(T2108 measures the percentage of stocks trading above their respective 40-day moving averages [DMAs]. It helps to identify extremes in market sentiment that are likely to reverse. To learn more about it, see my T2108 Resource Page. You can follow real-time T2108 commentary on twitter using the #T2108 hashtag. T2108-related trades and other trades are … Read more