Stock Market Commentary
Downtrends are over. Bullish breakouts abound. Sellers got one chance last week to try to keep the cork in the bottle of the oversold bounce, but they failed. The stock market insisted on pushing right through. With little time to rest, the S&P 500 and the NASDAQ ended the week with major milestones in place. The small caps lagged with just one up day, on Friday, for the week. Similarly, market breadth lagged all week as it rested from the previous week’s parabolic surge. With a bearish divergence narrowly avoided, the stock market in general looks poised to continue higher in the coming week.
The Stock Market Indices
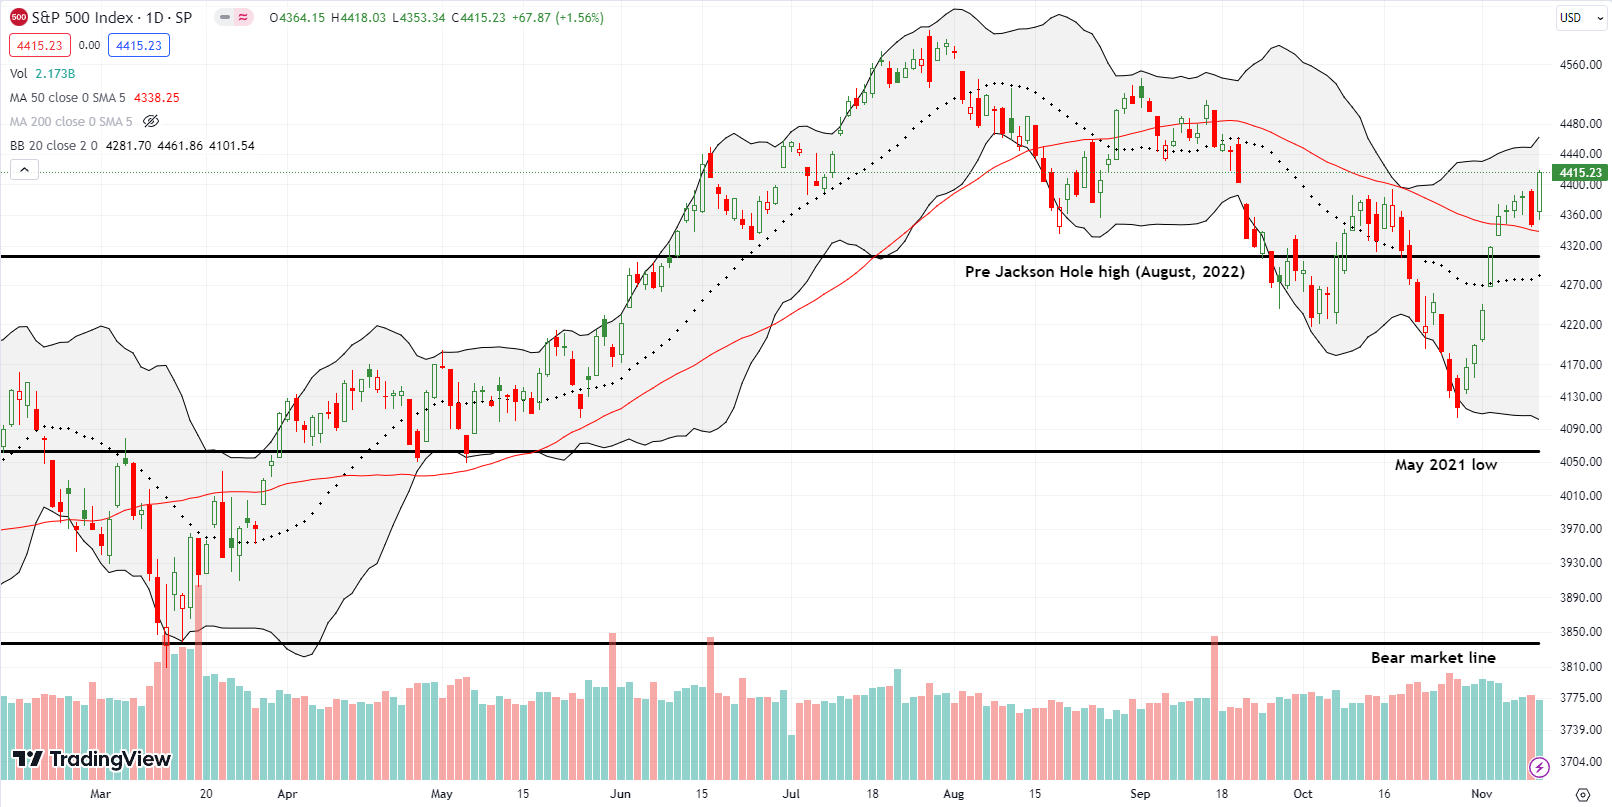
When the S&P 500 (SPY) dipped back to support at its 50-day moving average (DMA) (the red line) with a 0.8% loss, I did a scan for stocks with post-earnings fades to the downside. I immediately got (temporarily) distracted from those setups after the index gapped up and rallied for the rest of Friday. The S&P 500 closed strong with a 1.6% gain and a near 2-month high. The index is back in bullish positioning with a confirmed 50DMA breakout, confirmed 50DMA support, AND the end of the series of lower highs that put the S&P 500 in a downtrend. Moreover, the upper Bollinger Band (BB) is opening upward, further supporting the path of least resistance to the upside.
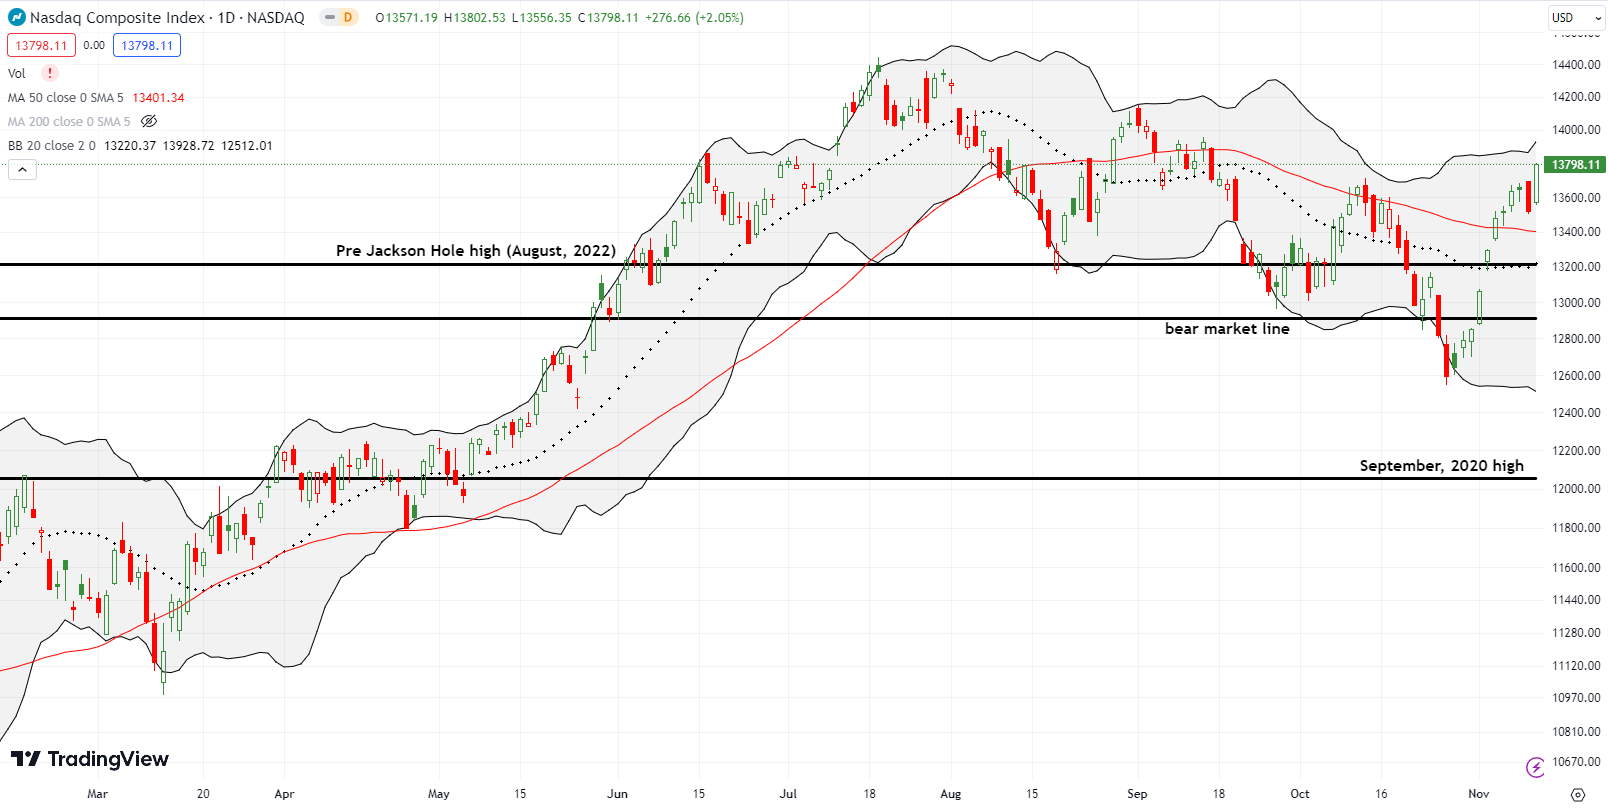
The NASDAQ (COMPQ) also broke out of its downtrend and has bullish positioning. While the tech-laden index did not print a test of 50DMA support, it is still in just as strong a bullish position. The NASDAQ closed the week at a 2-month high on the strength of a 2.1% gain on Friday.
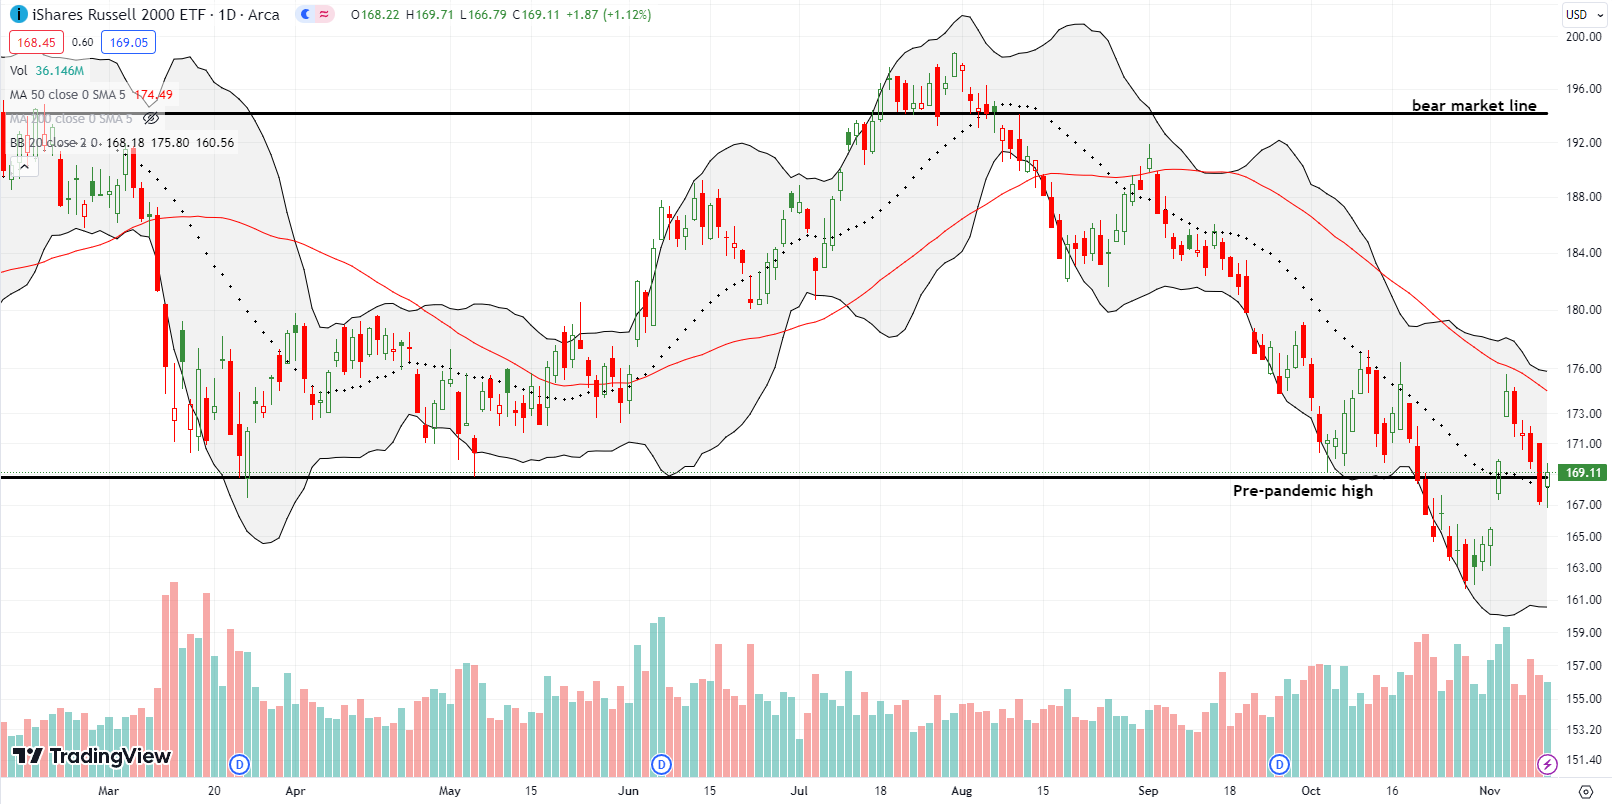
In the previous week, the iShares Russell 2000 ETF (IWM) lagged the other two major indices until the final two days of the week. Last week, IWM lagged again, this time significantly. On Friday, IWM’s 1.1% gain lagged the other indices and did not reverse the loss on Thursday as the other indices reversed their Thursday losses. The good news is that IWM held support at its 20DMA (the dotted line) with a pivot around the pre-pandemic high. I missed IWM’s 20DMA breakout so I jumped at the chance to play 20DMA support with a calendar call spread and a call option.
The Short-Term Trading Call With Little Time to Rest
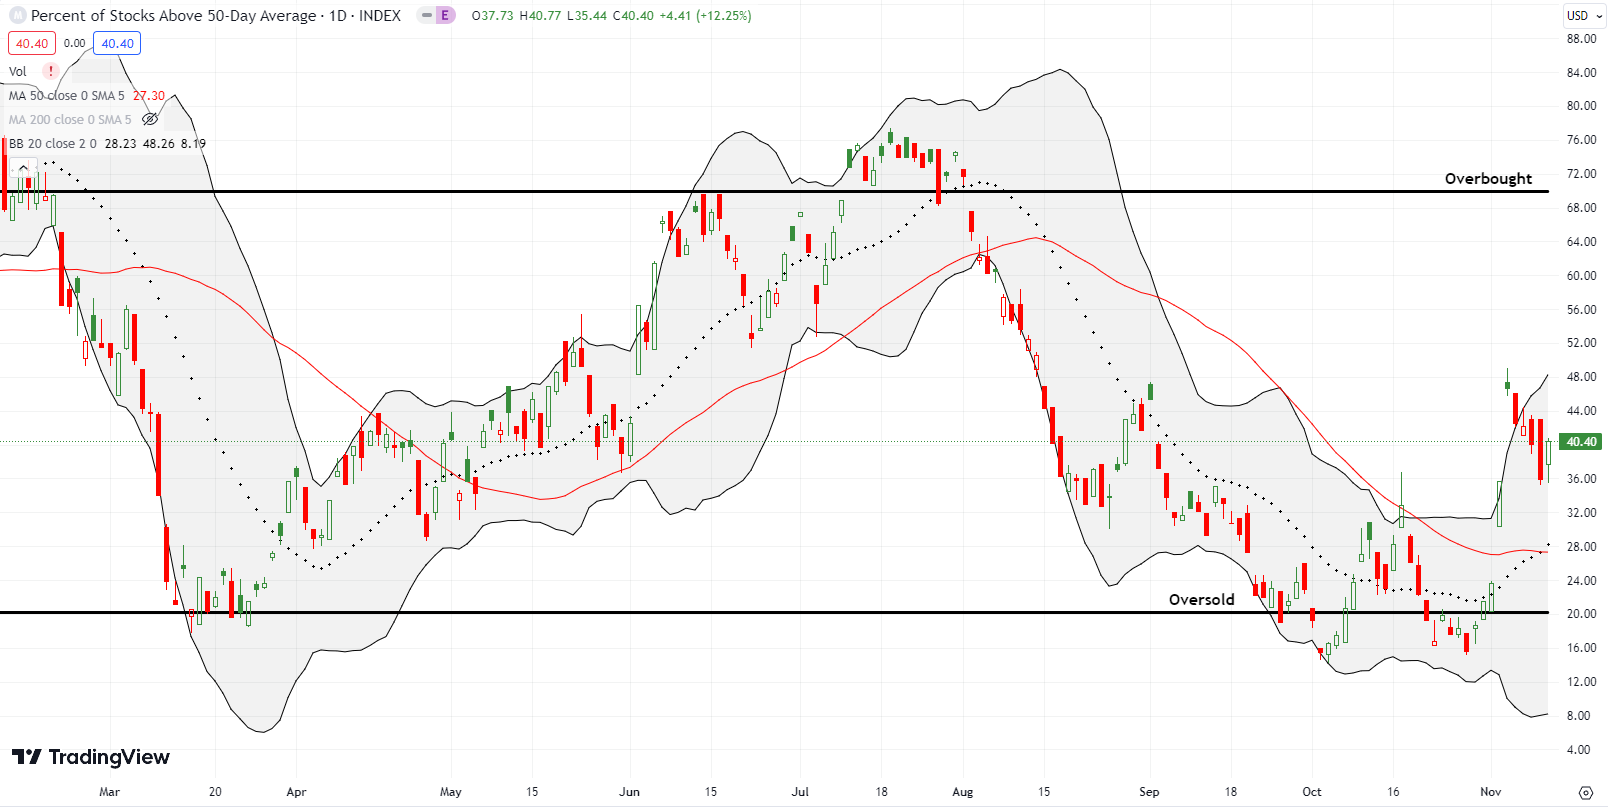
- AT50 (MMFI) = 40.4% of stocks are trading above their respective 50-day moving averages
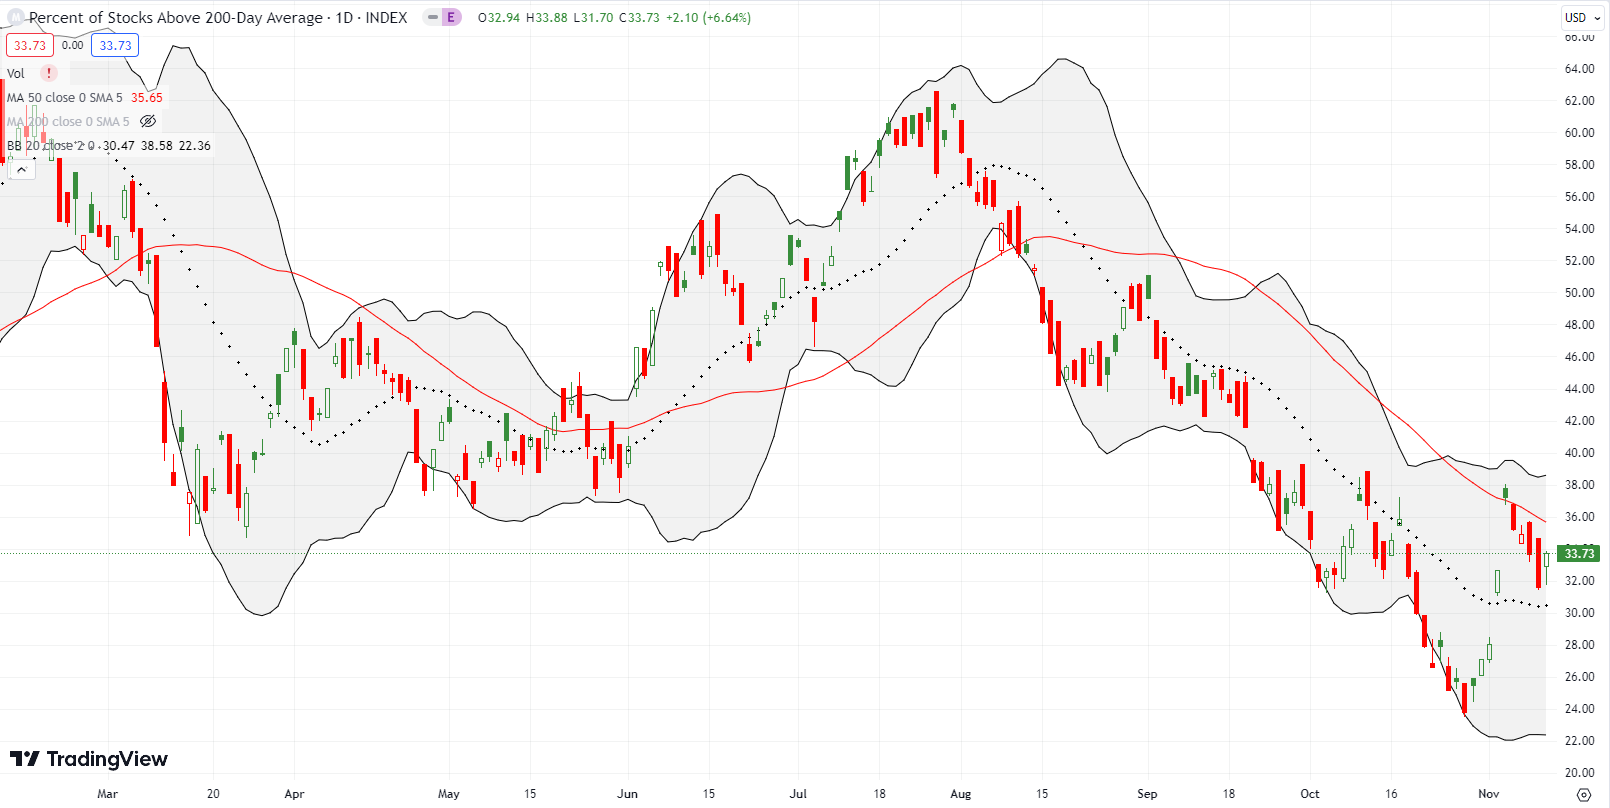
- AT200 (MMTH) = 33.7% of stocks are trading above their respective 200-day moving averages
- Short-term Trading Call: bullish
AT50 (MMFI), the percentage of stocks trading above their respective 50DMAs, followed the path of IWM. My favorite technical indicator wilted the first four days of the week. On Thursday, AT50 finished reversing the huge gain in market breadth from the previous Friday. AT50 finished the week with a small gain that provided a small indication that the cooling of the parabolic rise in market breadth is over. If so, the bullish positioning in the S&P 500 and the NASDAQ will get further reinforced. Last week’s little time to rest could transition into the coming week’s stubborn bullishness. Accordingly, I am focused on finding post-earnings stocks either pulling back to 50DMA support or breaking out above 50DMA resistance.
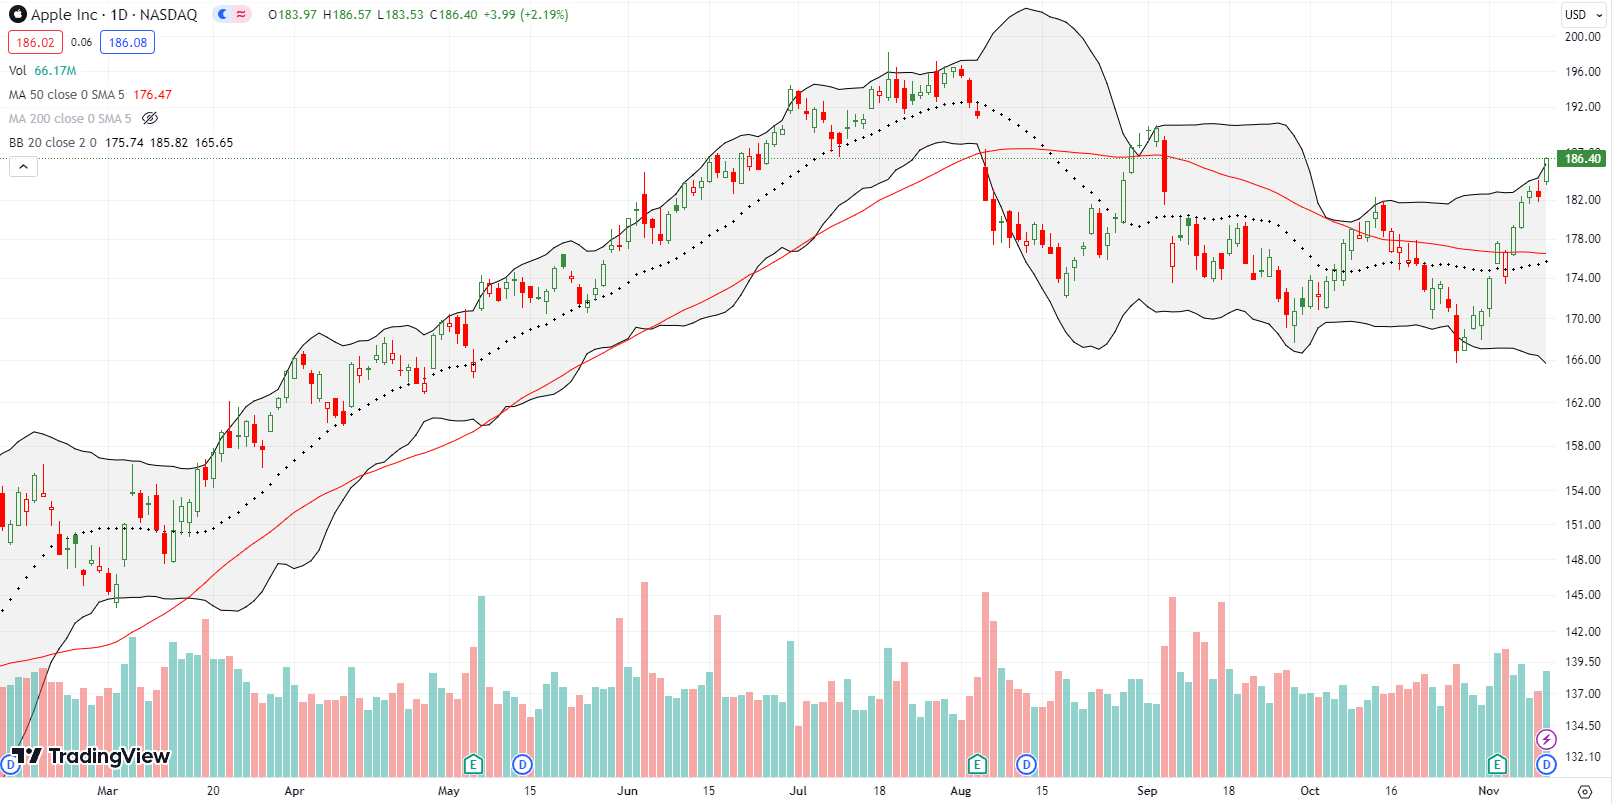
Apple (AAPL) was iconic last week. America’s favorite stock symbolized the surge for big cap tech. In turn, big cap tech led the way higher for the S&P 500 and the NASDAQ. AAPL’s downtrend ended in the wake of a post-earnings reaction that initially looked bearish. At the time, AAPL gapped below its 50DMA. Buyers have barely looked back ever since. I can now get back to business with the Apple Trading Model (ATM).
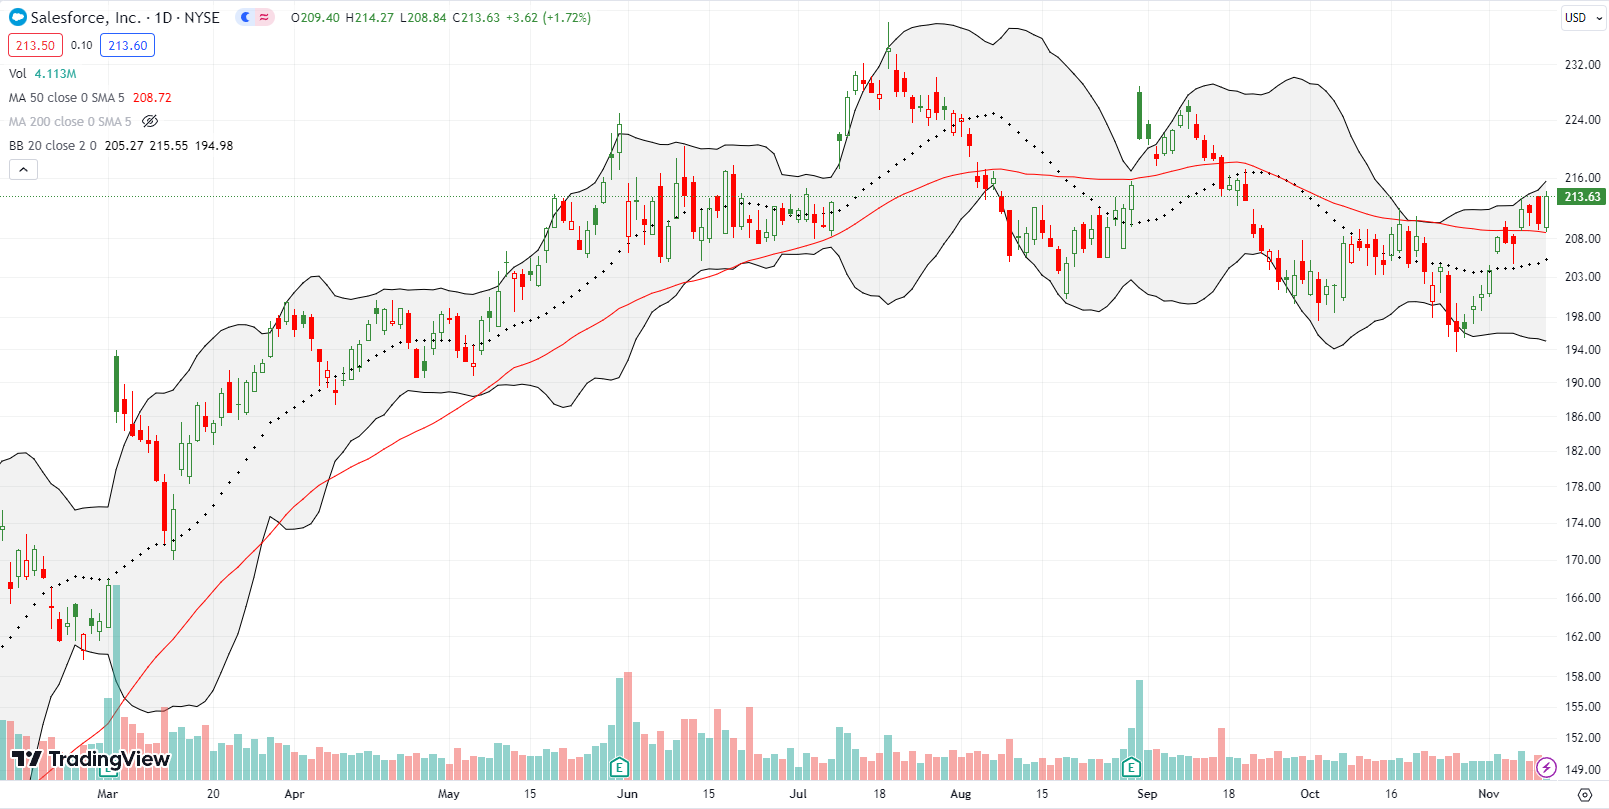
With the market in bullish positioning, I am on the hunt for stocks likes Salesforce.com, Inc (CRM). I bought a calendar call spread on Tuesday’s 50DMA breakout. From there CRM acted like a coiled spring by bouncing up and down while holding its 50DMA as support.
I thought I would roll into the coming week with an expired short side of the spread and an intact long side. Instead, CRM jumped just enough on Friday to hit my initial profit target. As a result, I am now hoping to buy a fresh drop toward 50DMA support. Otherwise, I will need to chase another breakout!
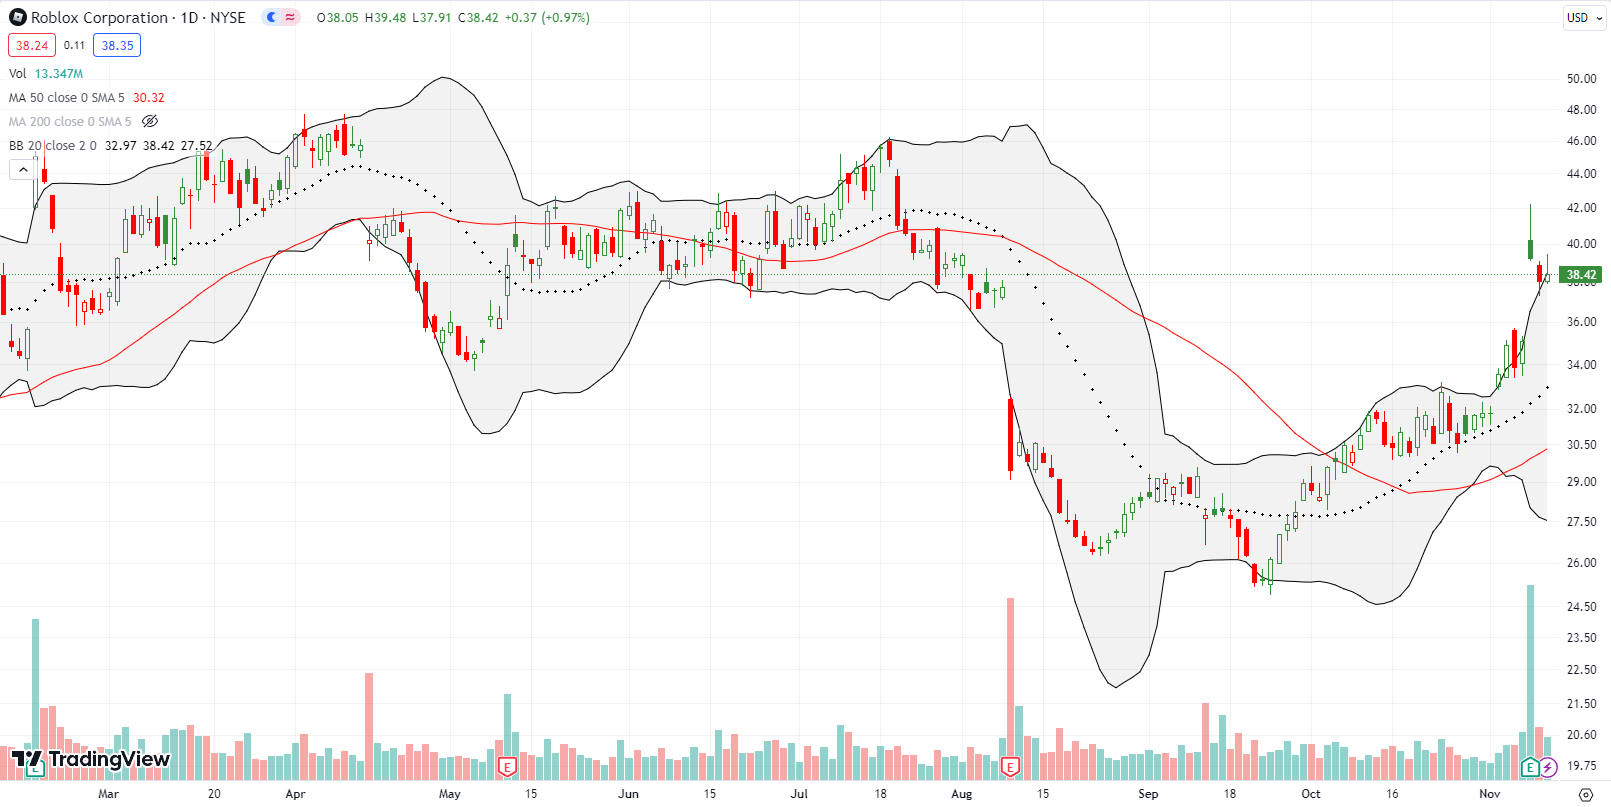
I am a fan of Roblox Corporation (RBLX) because my kids love it. Yet, I could not muster up the risk tolerance to hold shares through earnings. RBLX popped 11.8% post-earnings even with a fade from the highs. I have zero regrets since pre-earnings crystal balls are always dangerous. The good news is that RBLX looks well positioned as a buy here with a pattern known as a “calm after the storm“. As long as RBLX avoids a new post-earnings low, it is a buy for me in the coming week.
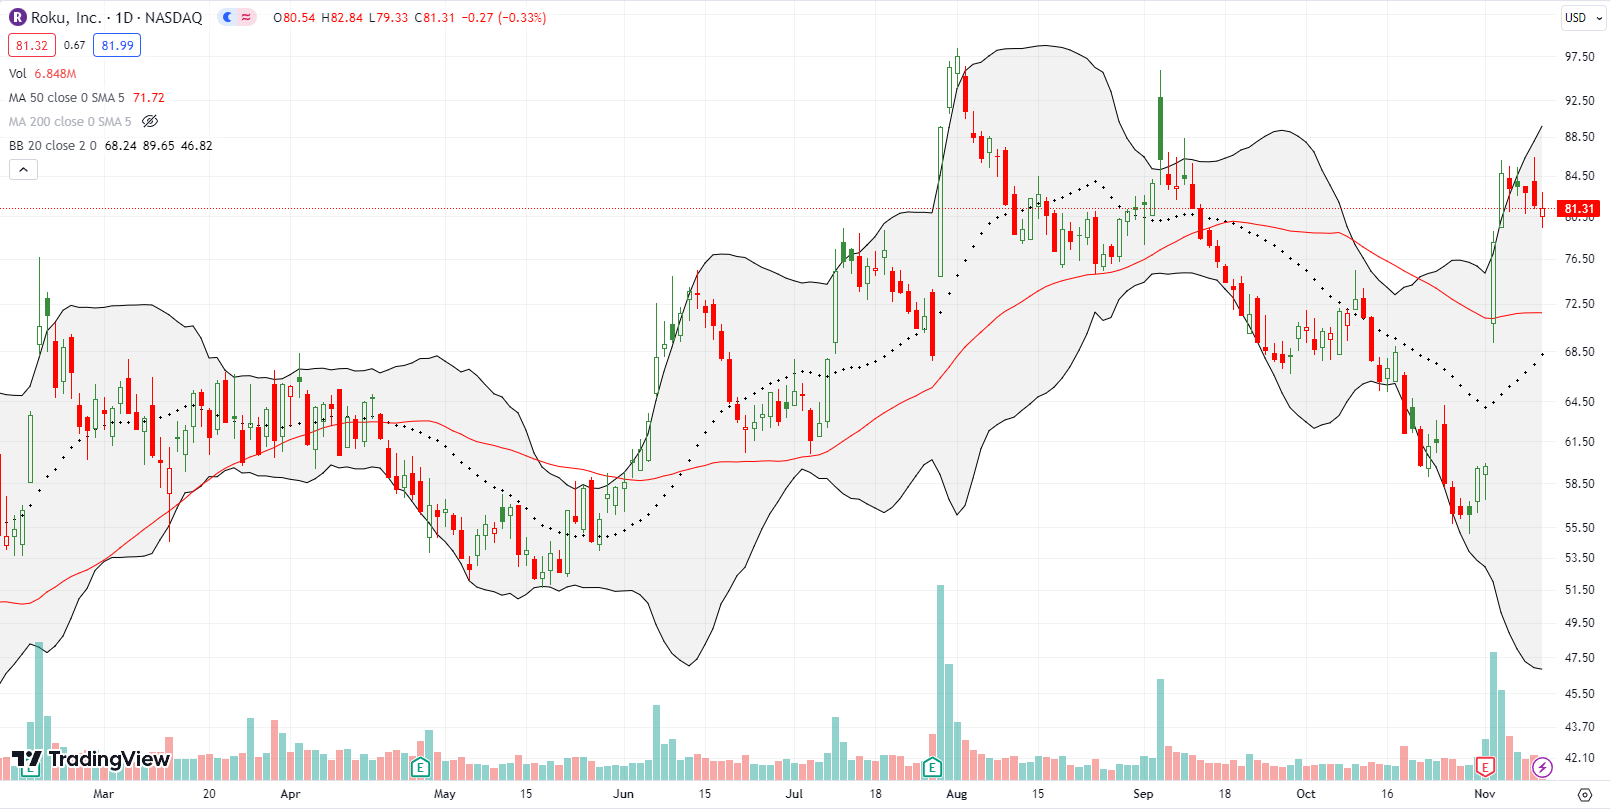
Roku, Inc (ROKU) surged 30.7% post-earnings in the previous week. Buyers tacked on another 8.6% the next day. So it makes a lot of sense that the stock took a long rest last week. I am closely watching the unfolding consolidation. I will trade ROKU in the direction of the breakout or the breakdown. Note how the stock stopped cold where in September it faded after issuing guidance for earnings and announcing layoffs. Thus, this juncture is extremely important!
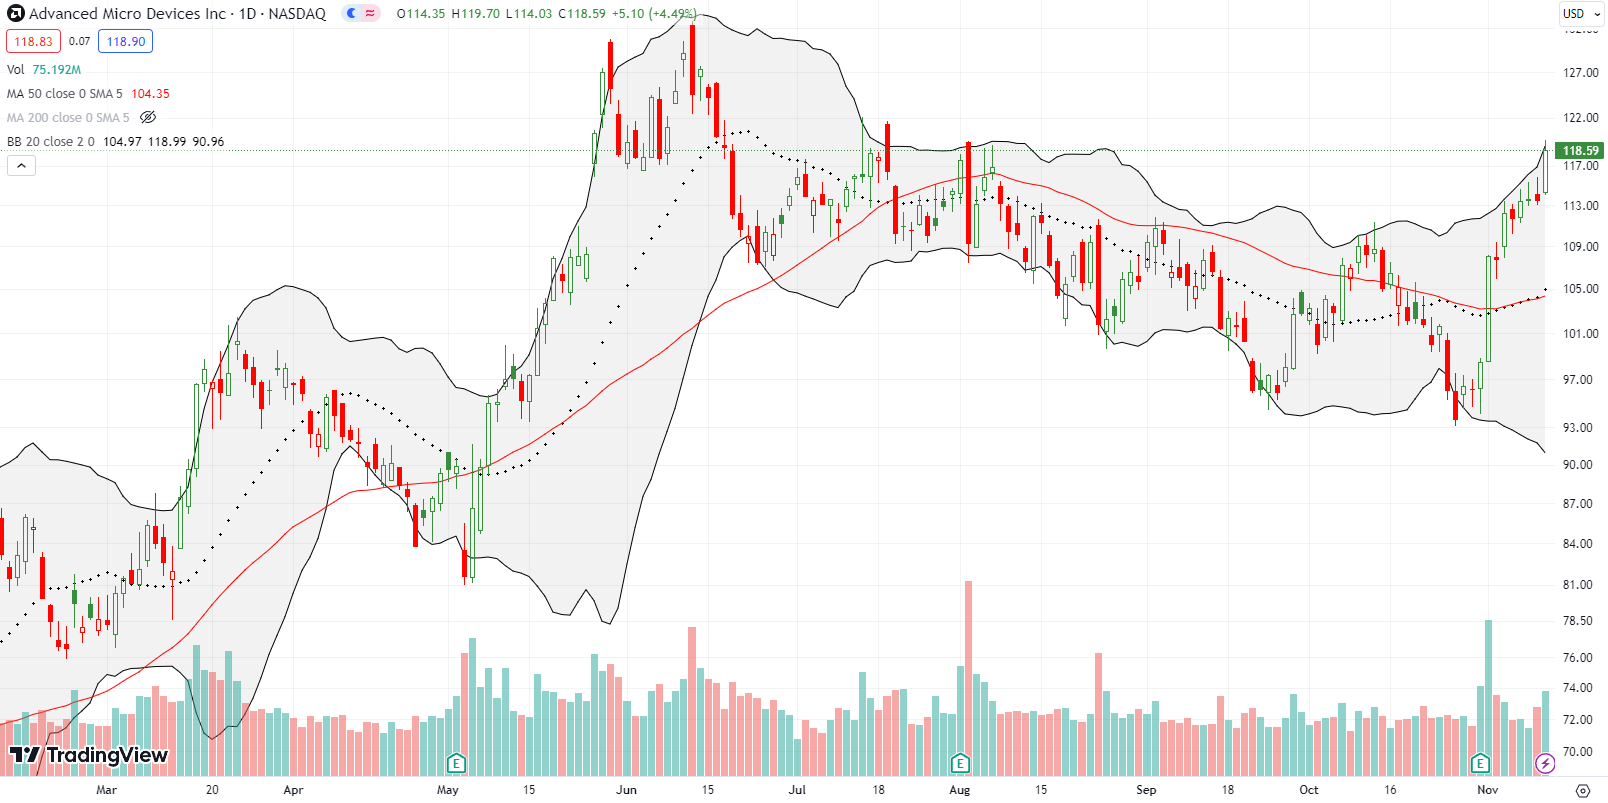
Given my generative AI trade, I should have been all over the breakout for Advanced Micro Devices Inc (AMD) following a 9.7% post-earnings surge. However, I somehow missed it. With the downtrend over, I am looking to buy the dip. AMD is currently over-extended at the upper BB.
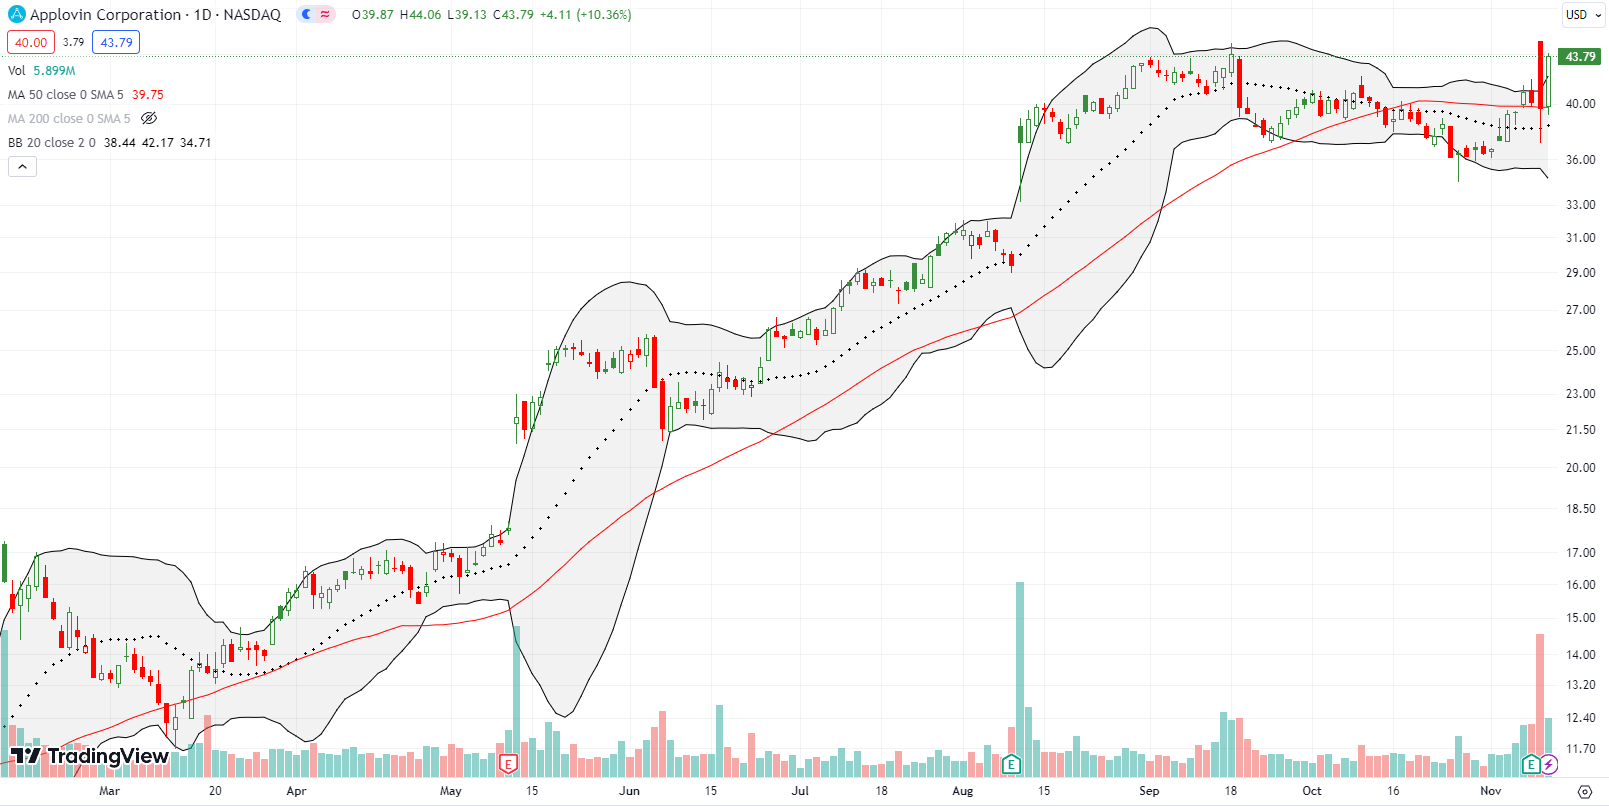
Applovin Corporation (APP) had a bizarre post-earnings experience. APP was up 14% or so in the after hours following earnings and gapped up 12.4% at the open. Sellers took over from there and took APP to a -1.1% close. Buyers stepped right back in the next day for a 10.4% pop. I have no idea how to explain the confusion except to recognize that the market knows nothing in this case. The important technical news is the resilience of 50DMA support.
APP’s strength going into earnings, including the 50DMA breakout, motivated me to take a chance at a pre-earnings call spread. I went from elation to bewilderment to gratitude that I escaped the position with a sliver of a profit! Still, APP is a buy here with a stop below the post-earnings close/intraday low.
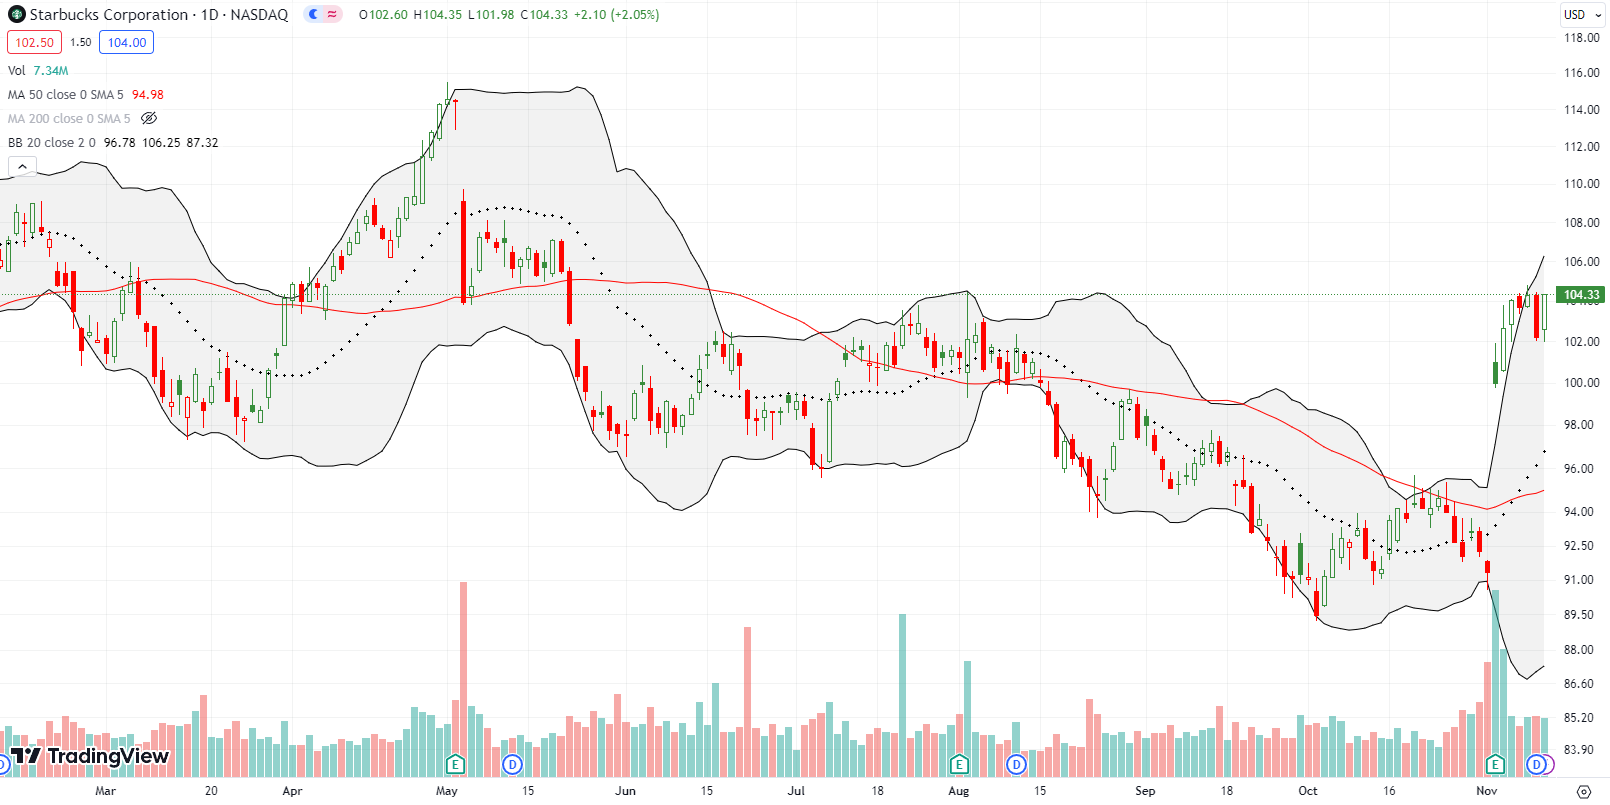
Starbucks Corporation (SBUX) enjoyed a 50DMA breakout after a 9.5% post-earnings jump. SBUX is now at a 6-month high with a bit of a back-and-forth last week. I am a buyer on the smallest nudge above this consolidation.
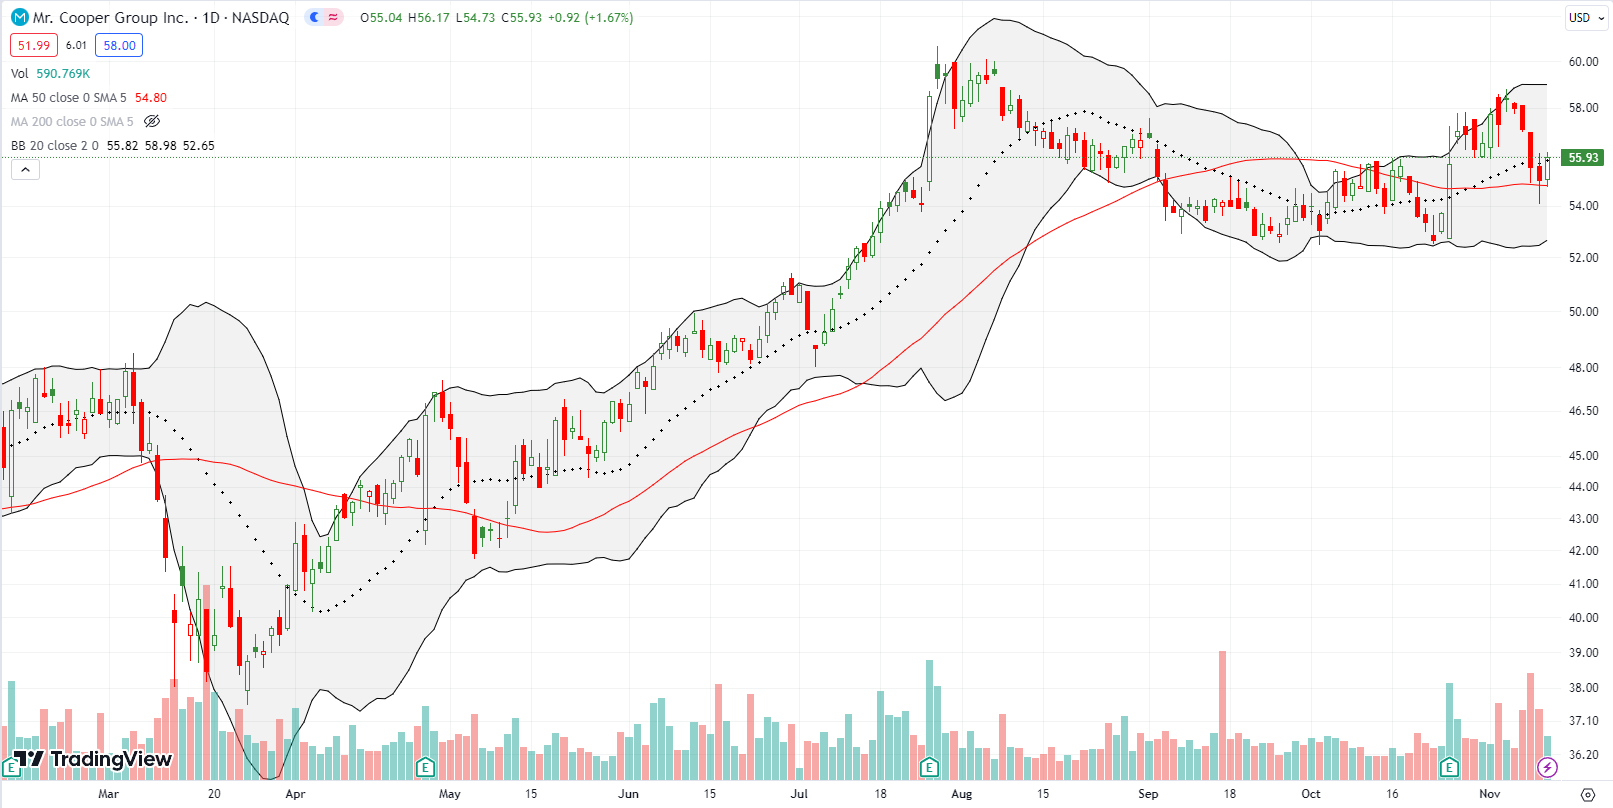
Mortgage servicing and originations company Mr. Cooper Group Inc (COOP) hit my radar as a bearish play with September’s 50DMA breakdown. Sellers never followed through. Now the scales have flipped. A 3.6% post-earnings punch through the 50DMA put COOP into a bullish position. COOP successfully tested 50DMA support on a pullback last week. So now the stock is on my buy list…with a short leash of course given the nature of the business.
Be careful out there!
Footnotes
Subscribe for free to get email notifications of future posts!
“Above the 50” (AT50) uses the percentage of stocks trading above their respective 50-day moving averages (DMAs) to measure breadth in the stock market. Breadth defines the distribution of participation in a rally or sell-off. As a result, AT50 identifies extremes in market sentiment that are likely to reverse. Above the 50 is my alternative name for “MMFI” which is a symbol TradingView.com and other chart vendors use for this breadth indicator. Learn more about AT50 on my Market Breadth Resource Page. AT200, or MMTH, measures the percentage of stocks trading above their respective 200DMAs.
Active AT50 (MMFI) periods: Day #4 over 20%, Day #2 over 30%, Day #1 over 40% (overperiod ending 43 days under 40%), Day #58 under 50% (underperiod), Day #63 under 60%, Day #66 under 70%
Source for charts unless otherwise noted: TradingView.com
Full disclosure: long IWM calendar call spread and call
FOLLOW Dr. Duru’s commentary on financial markets via StockTwits, Twitter, and even Instagram!
*Charting notes: Stock prices are not adjusted for dividends. Candlestick charts use hollow bodies: open candles indicate a close higher than the open, filled candles indicate an open higher than the close.


1 thought on “Little Time to Rest for the Oversold Bounce – The Market Breadth”