Stock Market Commentary
Market breadth tentatively tested the overbought threshold before buyers got a hit and made a dash into overbought conditions. The previous tentativeness created a first strike against the market rally. The dash into overbought conditions refreshed a broad bullishness in the stock market. Long-term interest rates were once again the center of attention: another plunge in rates encouraged the dash for stocks. These days, the bond market seems to find any excuse to buy bonds, and this time the excuse came in the form of remarks from Federal Reserve Chair Jerome Powell at Spelman College (the first time a Fed official has made an appearance at Spelman). As best as I can tell, here is the key quote that selectively motivated a bullish response from the financial markets:
“Having come so far so quickly, the FOMC is moving forward carefully, as the risks of under- and over-tightening are becoming more balanced.”
This statement reinforces expectations for the end of the Fed’s rate tightening cycle. Late in the Q&A session, Powell also acknowledged that the economy is slowing. However, a balanced read of Powell’s remarks reveals no new news. Powell even reemphasized the Fed’s vigilance and repeated a familiar refrain pleading with markets not to get ahead of schedule on rate cuts (emphasis mine):
“The FOMC is strongly committed to bringing inflation down to 2 percent over time, and to keeping policy restrictive until we are confident that inflation is on a path to that objective. It would be premature to conclude with confidence that we have achieved a sufficiently restrictive stance, or to speculate on when policy might ease. We are prepared to tighten policy further if it becomes appropriate to do so.”
With that context, perhaps it is no surprise that stock market bears remain stubbornly negative. Despite getting crushed in November, bears increased their positions last month! From a Yahoo Finance article “Short Sellers See $80 Billion Hit as November Rally Upends Bets“:
“Ihor Dusaniwsky, managing director of predictive analytics at S3, said the volume of open short positions rose to about $940 billion by Nov. 30 from $838 billion on Nov. 2.”
In other words, buying stocks despite overbought conditions remains somewhat contrarian!
The Stock Market Indices
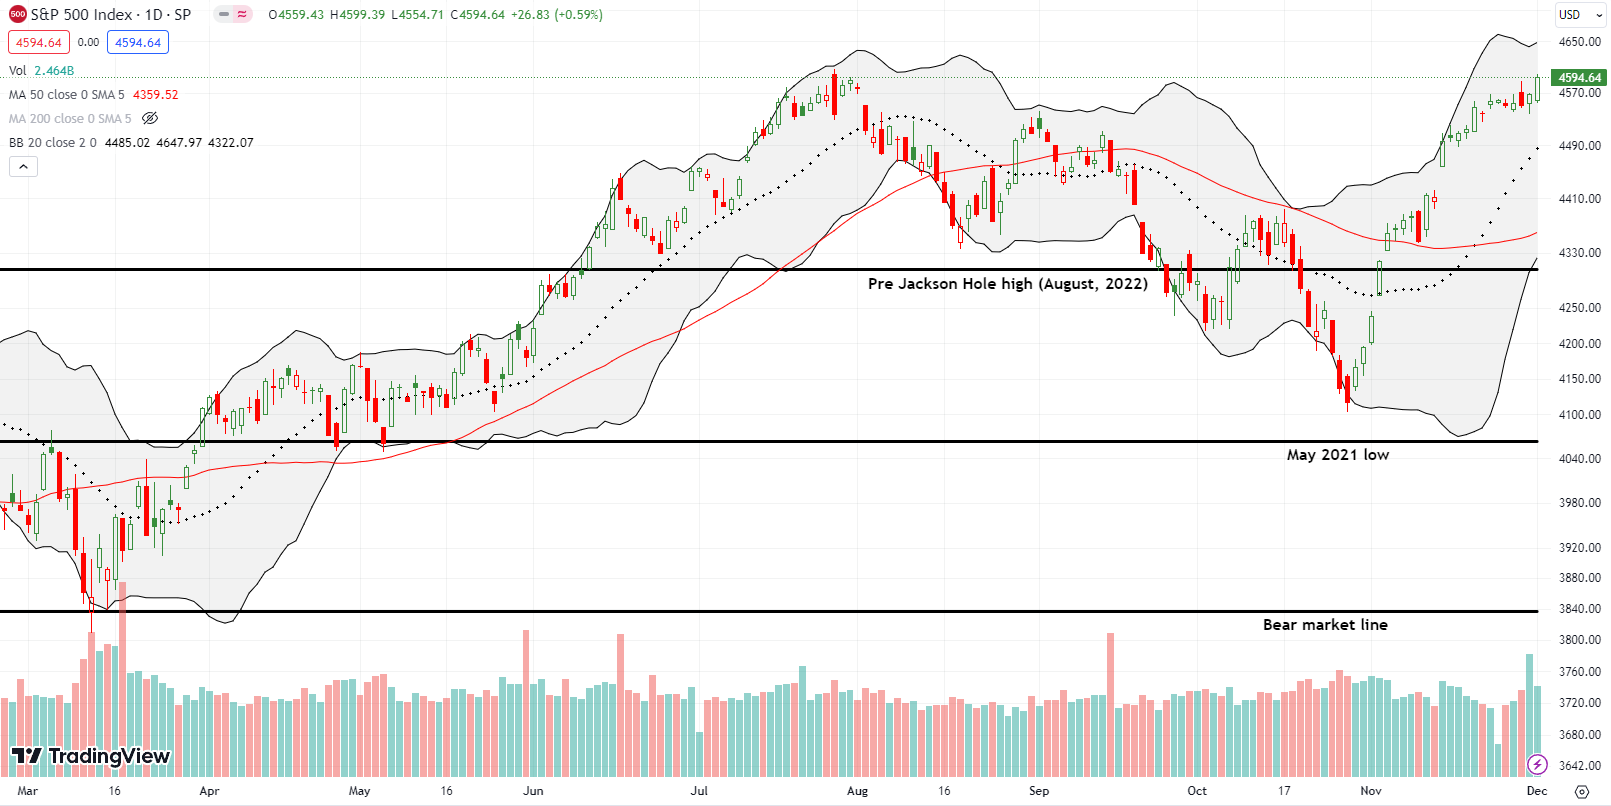
The S&P 500 (SPY) churned all week with a slight upward bias. Friday’s 0.6% jump resolved the battle to the upside with a 20-month closing high. With the upper Bollinger Band® (BB) turning higher, the technicals are clearing a path for an extension of the rally….much to the chagrin of last month’s increased bearishness.
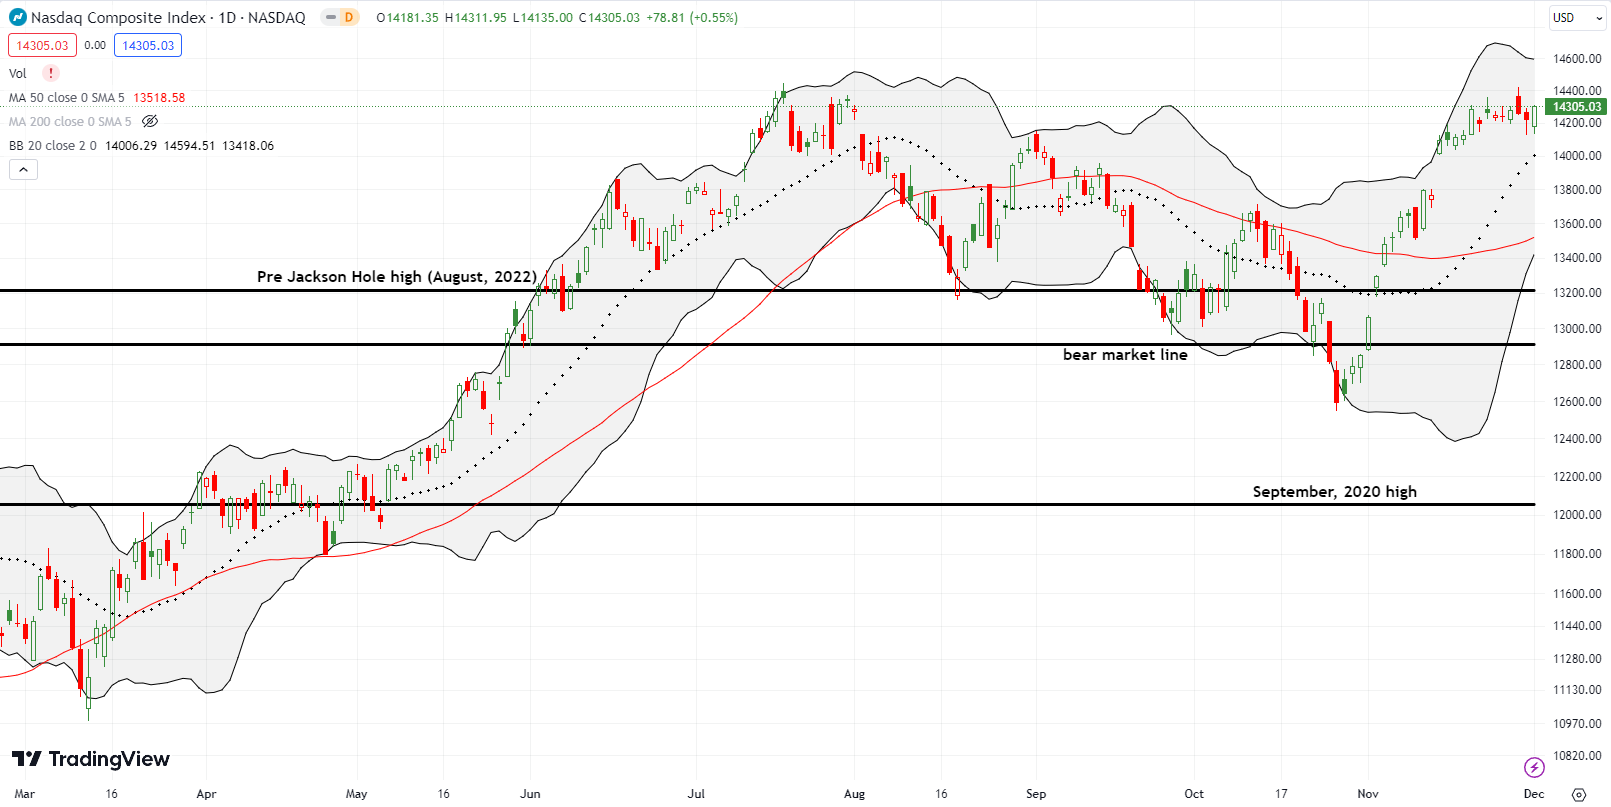
The NASDAQ (COMPQ) finally underperformed the S&P 500. The tech laden index churned all week with a net result at flatline. Friday’s 0.6% gain created a closing high for the week but did not clear the intraday highs or the highs of the year from the summer. The NASDAQ may need a nudge from rapidly rising support from its 20-day moving average (DMA) (the dotted line).
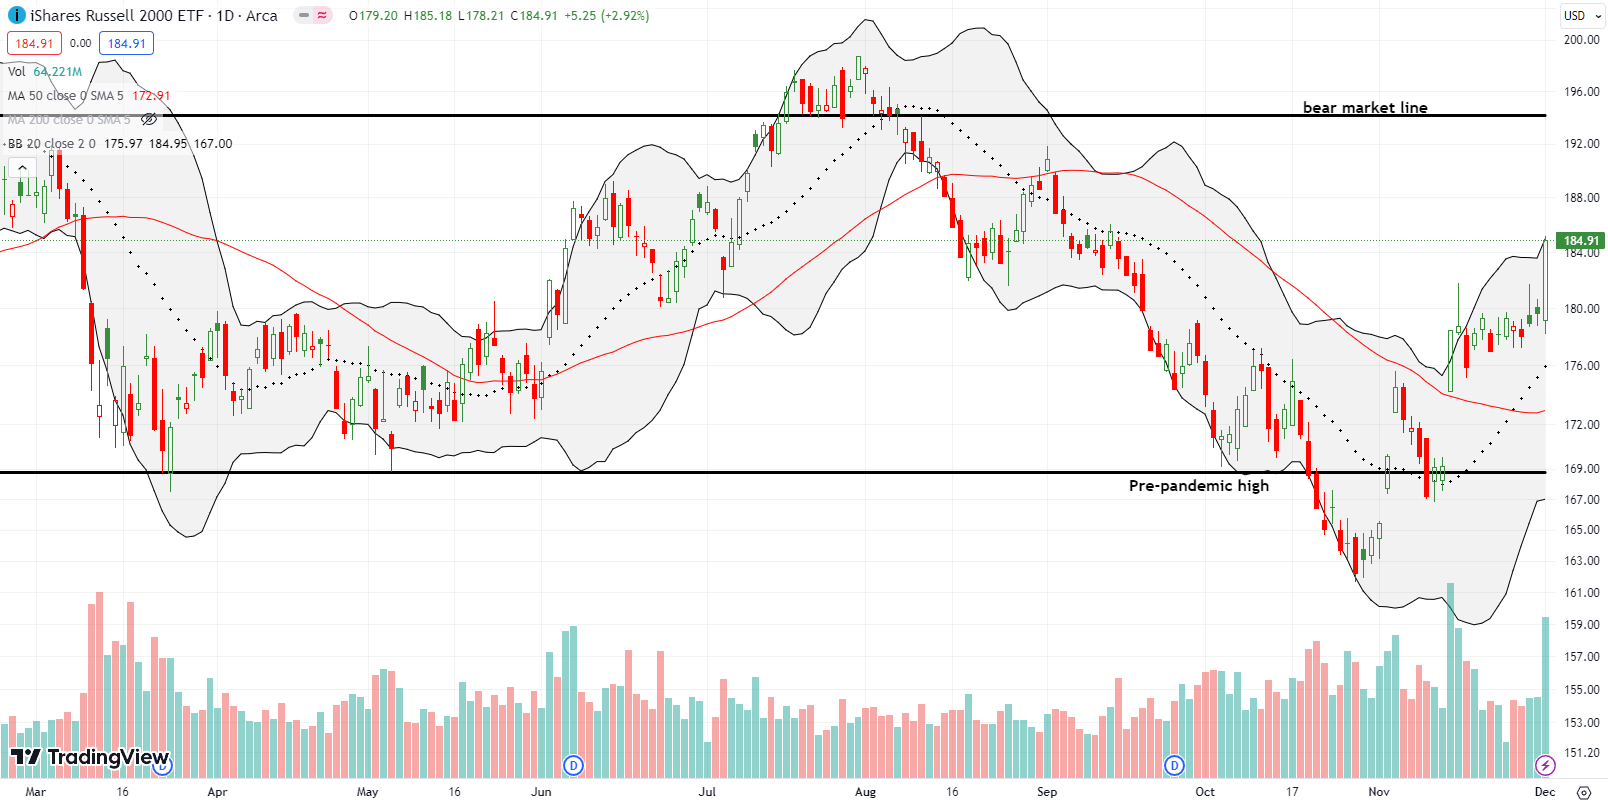
The iShares Russell 2000 ETF (IWM) definitely resolved the week’s churn to the upside! The ETF of small caps gained 2.9% on Friday and closed at a 2 1/2 month high. I went from expecting to carry the long side of my IWM calendar call spread into next week to realizing that the spread hit my initial profit target. Given the $181 strike for the spread, I was fortunate even as I failed to realize the full profit opportunity from betting on a breakout for IWM.
The Short-Term Trading Call With A Dash Into Overbought
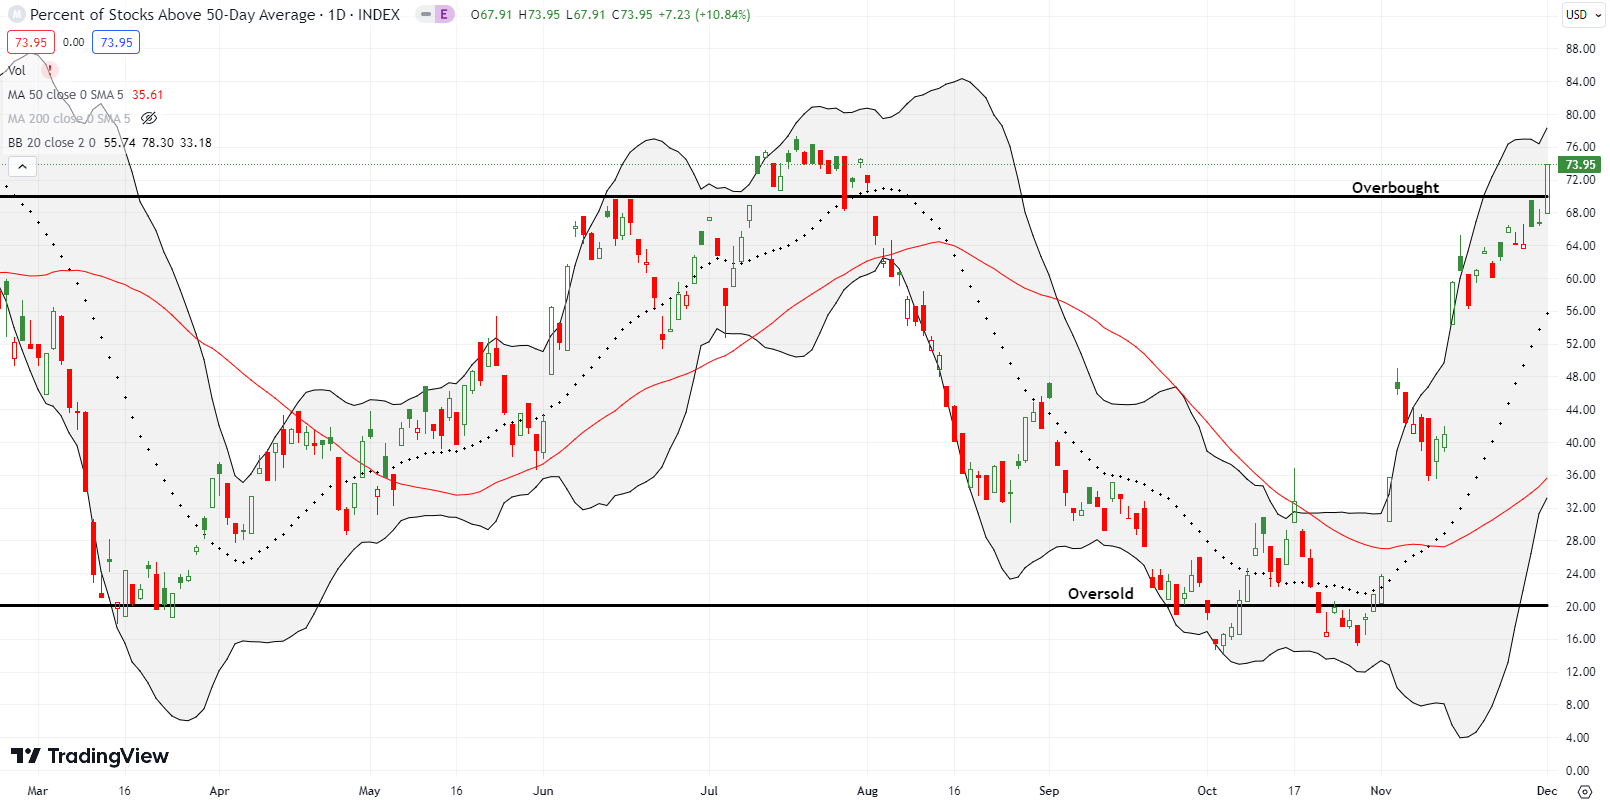
- AT50 (MMFI) = 74.0% of stocks are trading above their respective 50-day moving averages (ending a 1-day oversold period)
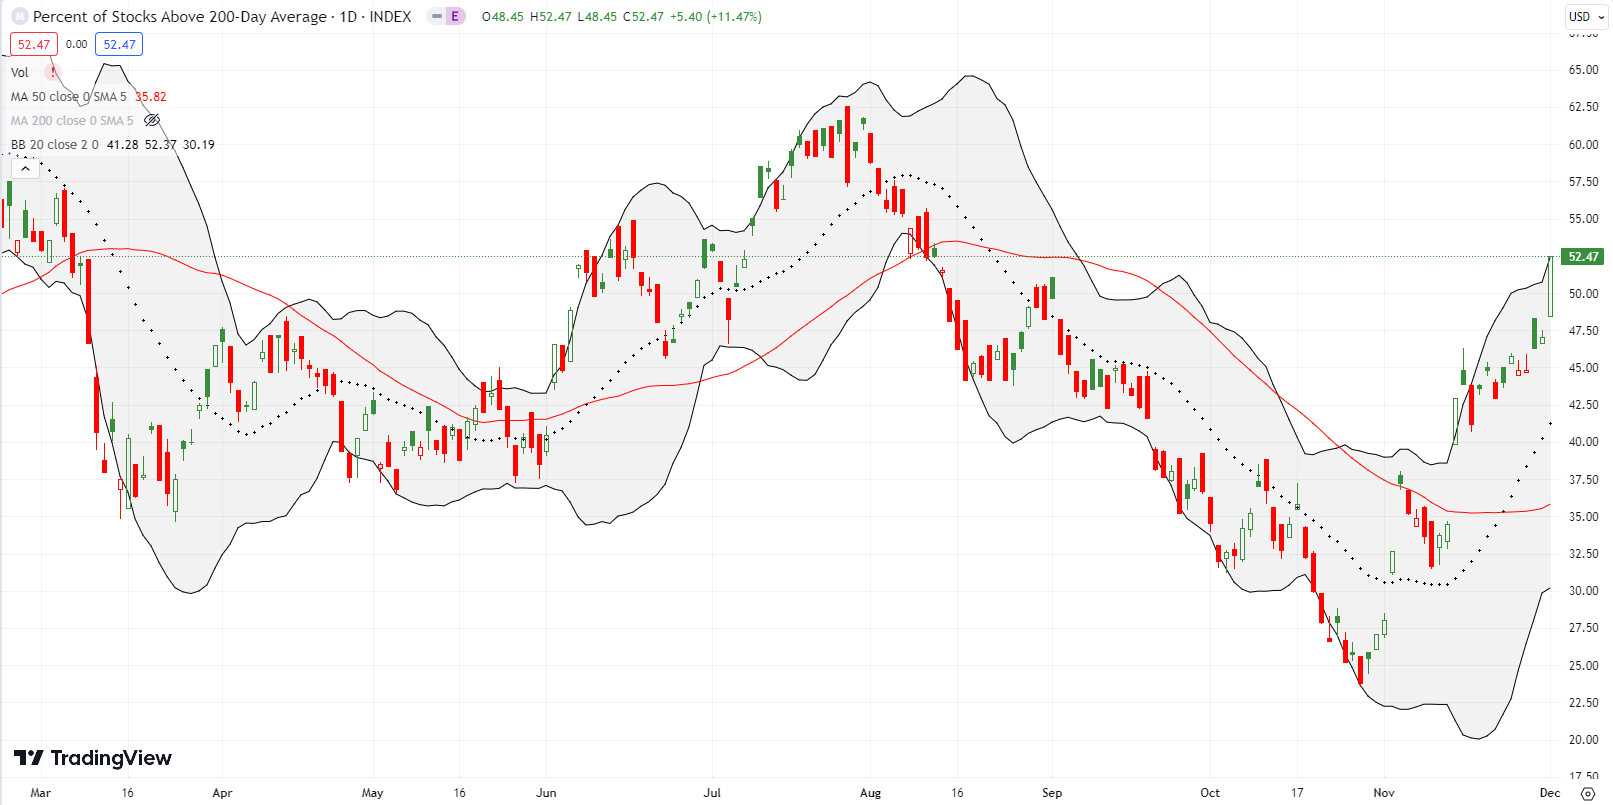
- AT200 (MMTH) = 52.5% of stocks are trading above their respective 200-day moving averages
- Short-term Trading Call: neutral
AT50 (MMFI), the percentage of stocks trading above their respective 50DMAs, closed the week in overbought territory. After tapping the overbought threshold and fading on Wednesday, my favorite technical indicator created a precarious juncture for the short-term trading call. Fortunately, AT50 did not confirm the bearish implications of the failure at the overbought threshold.
I say “fortunately” because I am not mentally prepared to flip bearish on this stock market. As I mentioned in the last Market Breadth, my watchlists remain chock full of very bullish patterns and setups. This dash into overbought territory is exactly what I would expect out of a bullish market that enjoys buying support. Still, I am keeping the short-term trading call at neutral to both avoid churn and to get myself mentally prepared for the inevitability of a coming bearish period…however short it might last.
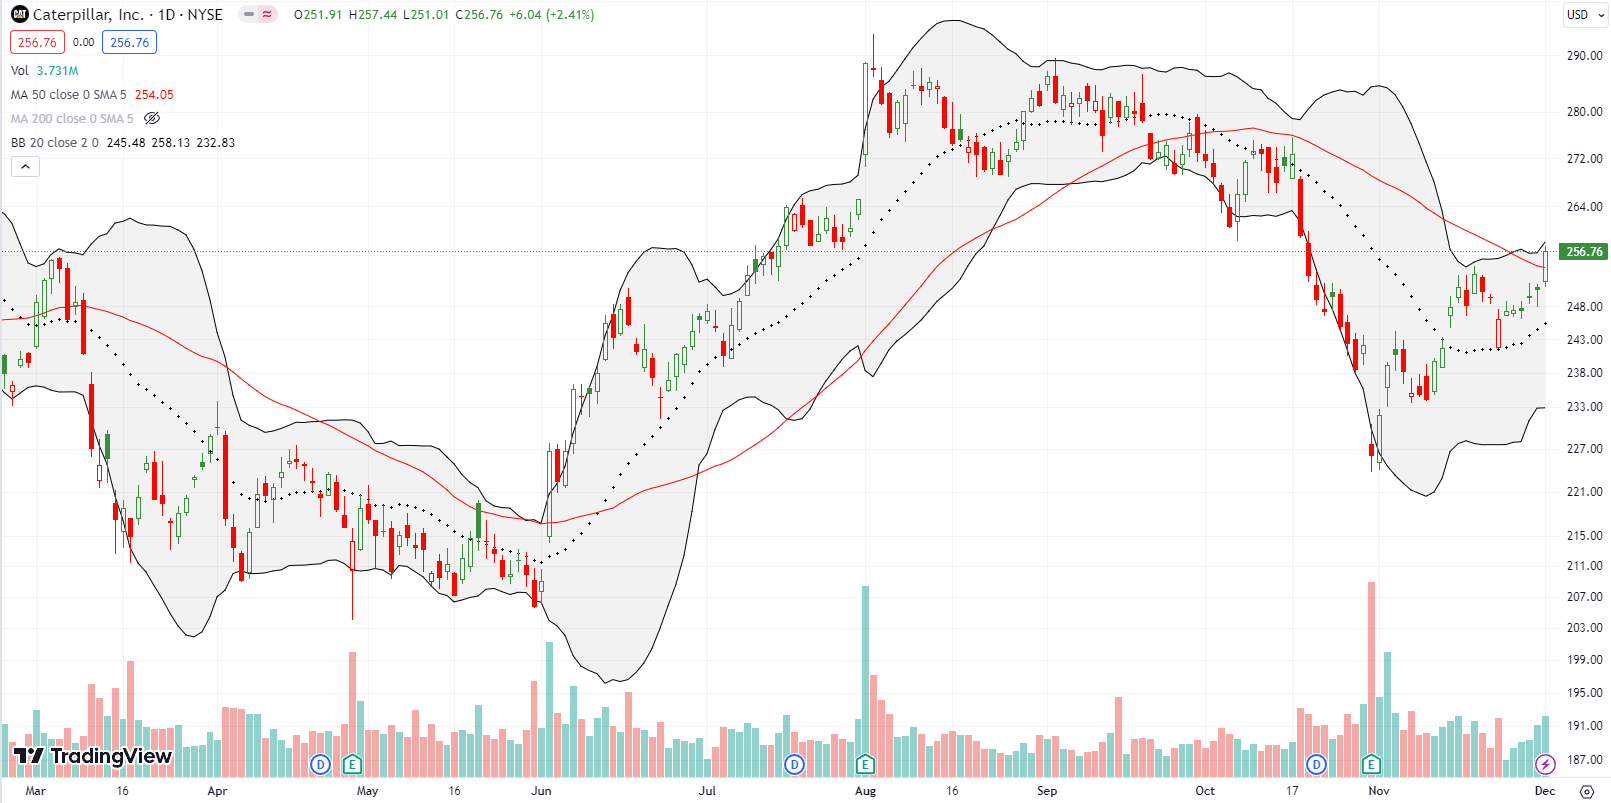
Caterpillar, Inc (CAT) is my favorite hedge against bullishness. CAT itself finally flipped bullish with a breakout above its 50-day moving average (DMA) resistance. CAT’s 20DMA is also turning up and supports an eventual confirmation of the breakout. Note how CAT quickly recovered from a very bearish pre and post-earnings breakdown in October. I am once again left scratching my head trying to understand the market’s interpretation of fundamental realities. The technicals without the fundamental overlay are so much easier to understand.
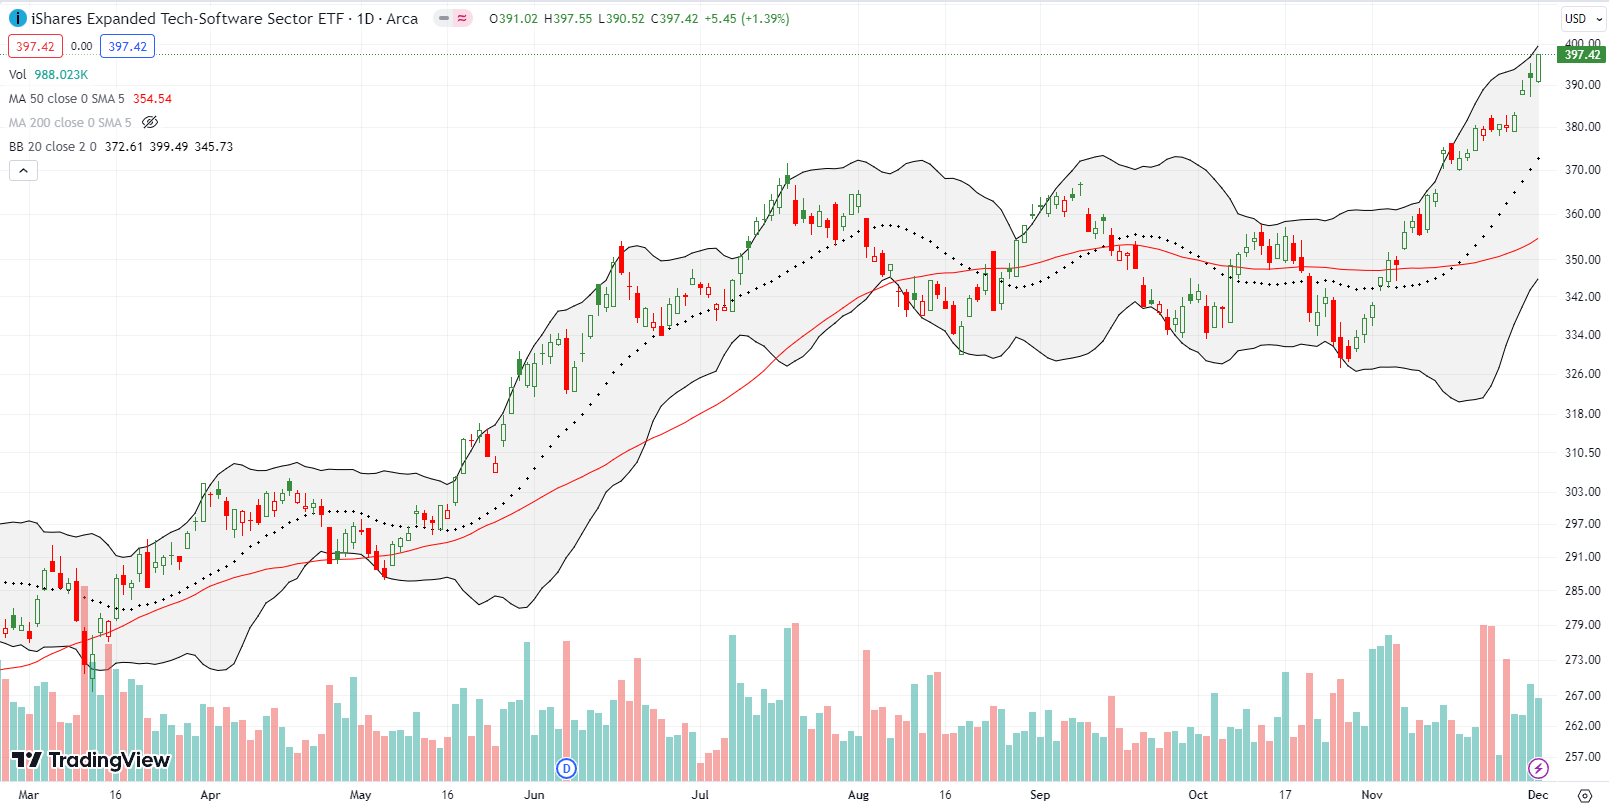
It turns out spending on enterprise software is far from dead. I went into last week with a call spread on iShares Expanded Tech-Software Sector ETF (IGV) as a bet on a breakout. That breakout came on Wednesday, and I took profits on Friday’s 1.4% follow-through. If not for overbought conditions, I would have held on to squeeze out a little more. IGV has incredibly now reversed all of its losses from 2022. The ETF closed right where it ended 2021.
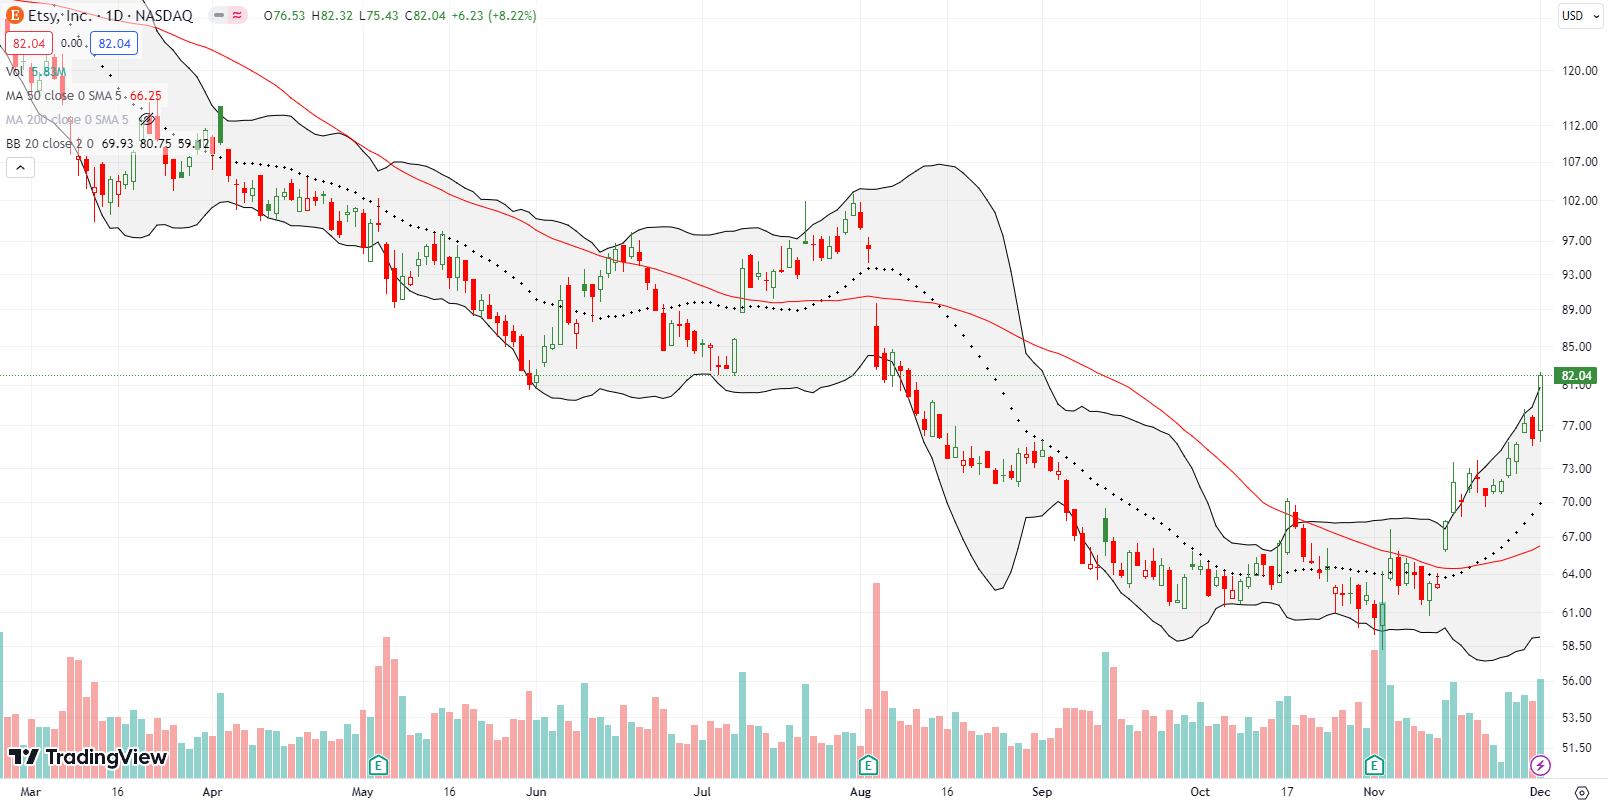
Etsy Inc (ETSY) is one of the many bullish charts that prevents me from getting negative about this overbought period. ETSY achieved and confirmed a 50DMA breakout in mid-November. This bullish move confirmed a turn in sentiment starting with the earnings report two weeks prior. I bought a Dec 80/85 call spread on Wednesday’s breakout. I am hoping to hold this one to close to maximum profit over the next two weeks.
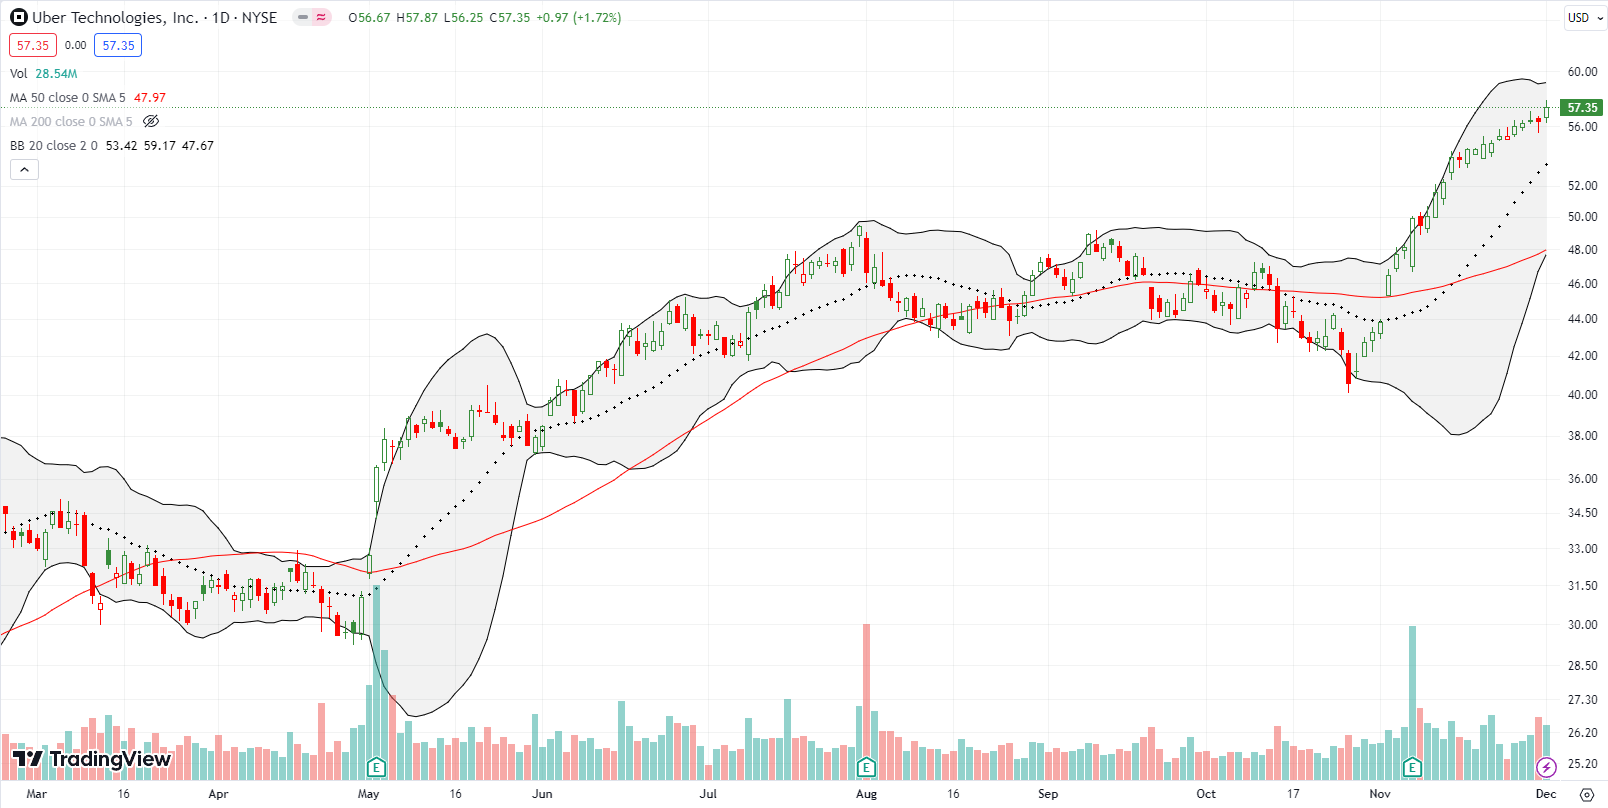
The S&P 500 stole my steam on Uber Technologies, Inc (UBER). The steady drift higher and approach to all-time highs put UBER on my buy list for next week. After hours on Friday, the S&P 500 announced it will add UBER to its index. That news sent the stock soaring about 5% in after hours. I will not chase UBER higher on Monday morning’s presumed gap higher. Now I will be on watch for a breakout to all-time highs. This news is also a reminder of how overbought conditions are not by themselves bearish.
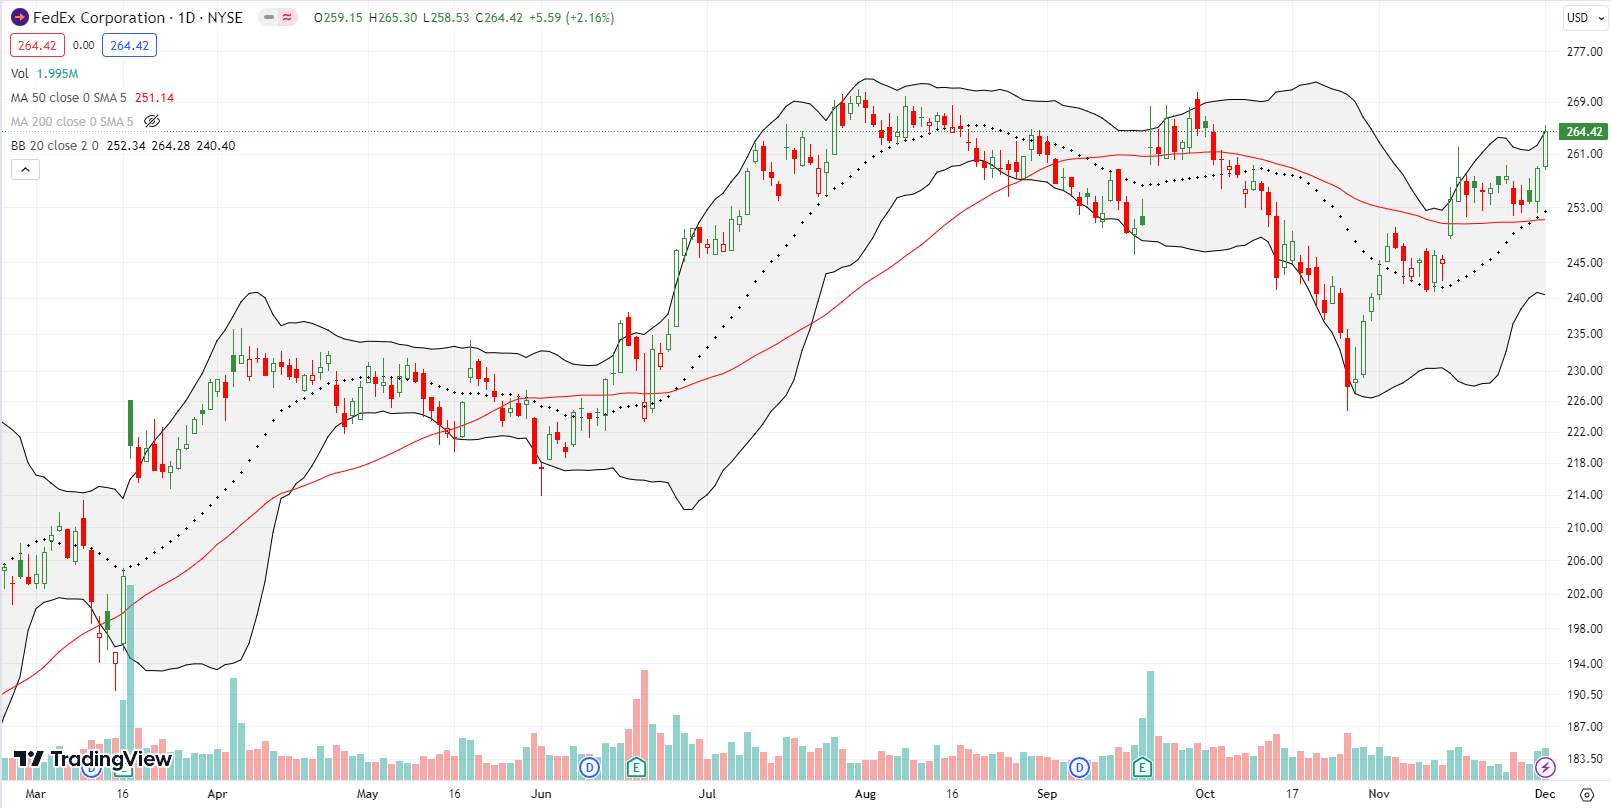
The V-recovery for FedEx Corp (FDX) continued last week. With Friday’s 2.2% surge, FDX definitely confirmed its earlier 50DMA breakout. The stock is now closing in on an even more bullish breakout above its 2023 high.
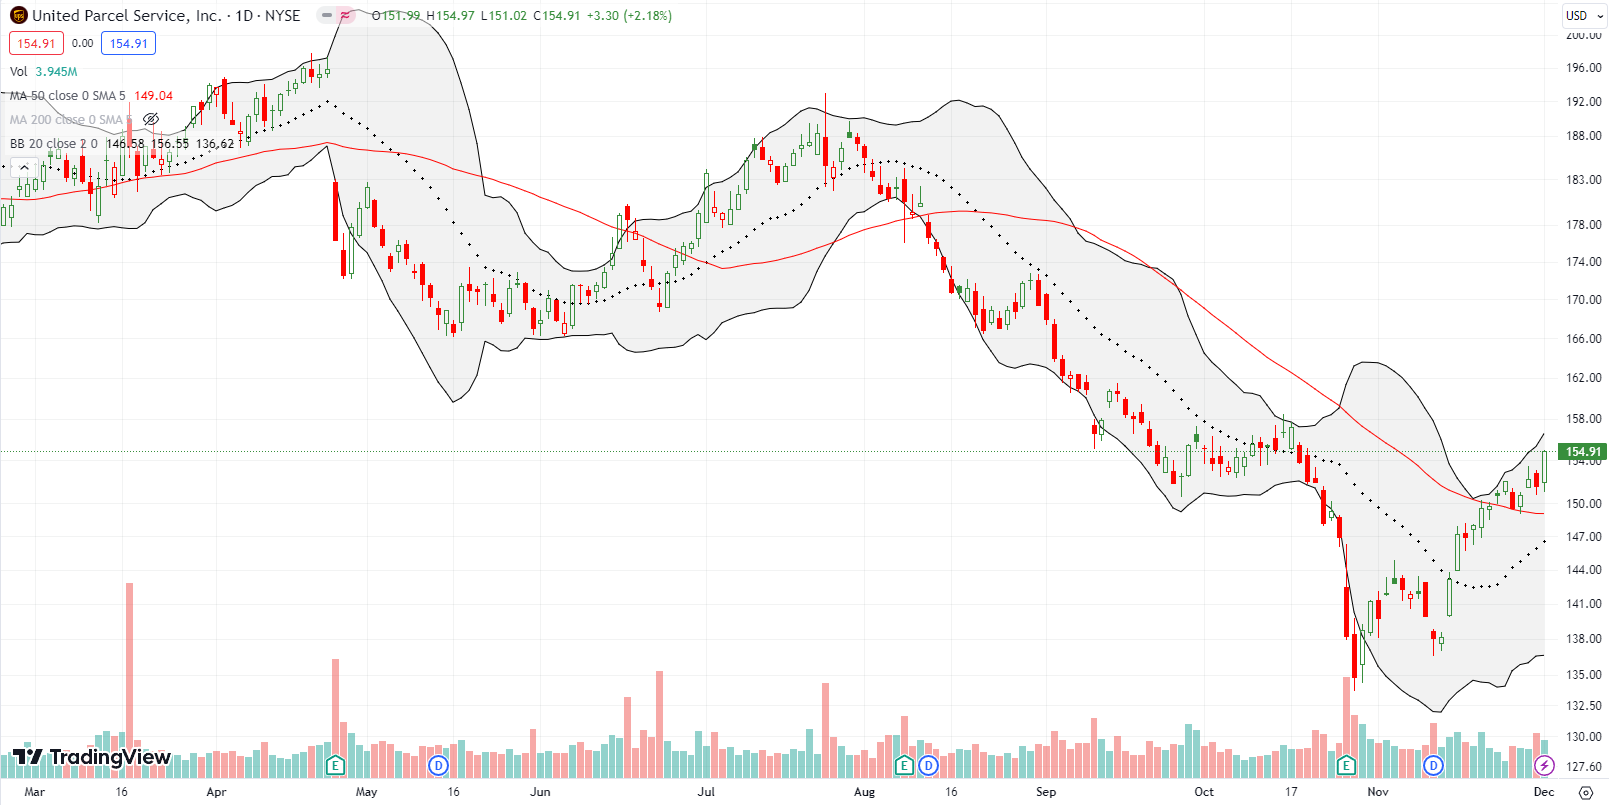
The bullish flip in FDX motivated me to buy into the 50DMA breakout for United Parcel Services, Inc (UPS). I bought a January $155/$165 call spread earlier in the week with the hopes I can ride out whatever comes of overbought conditions in the near-term.
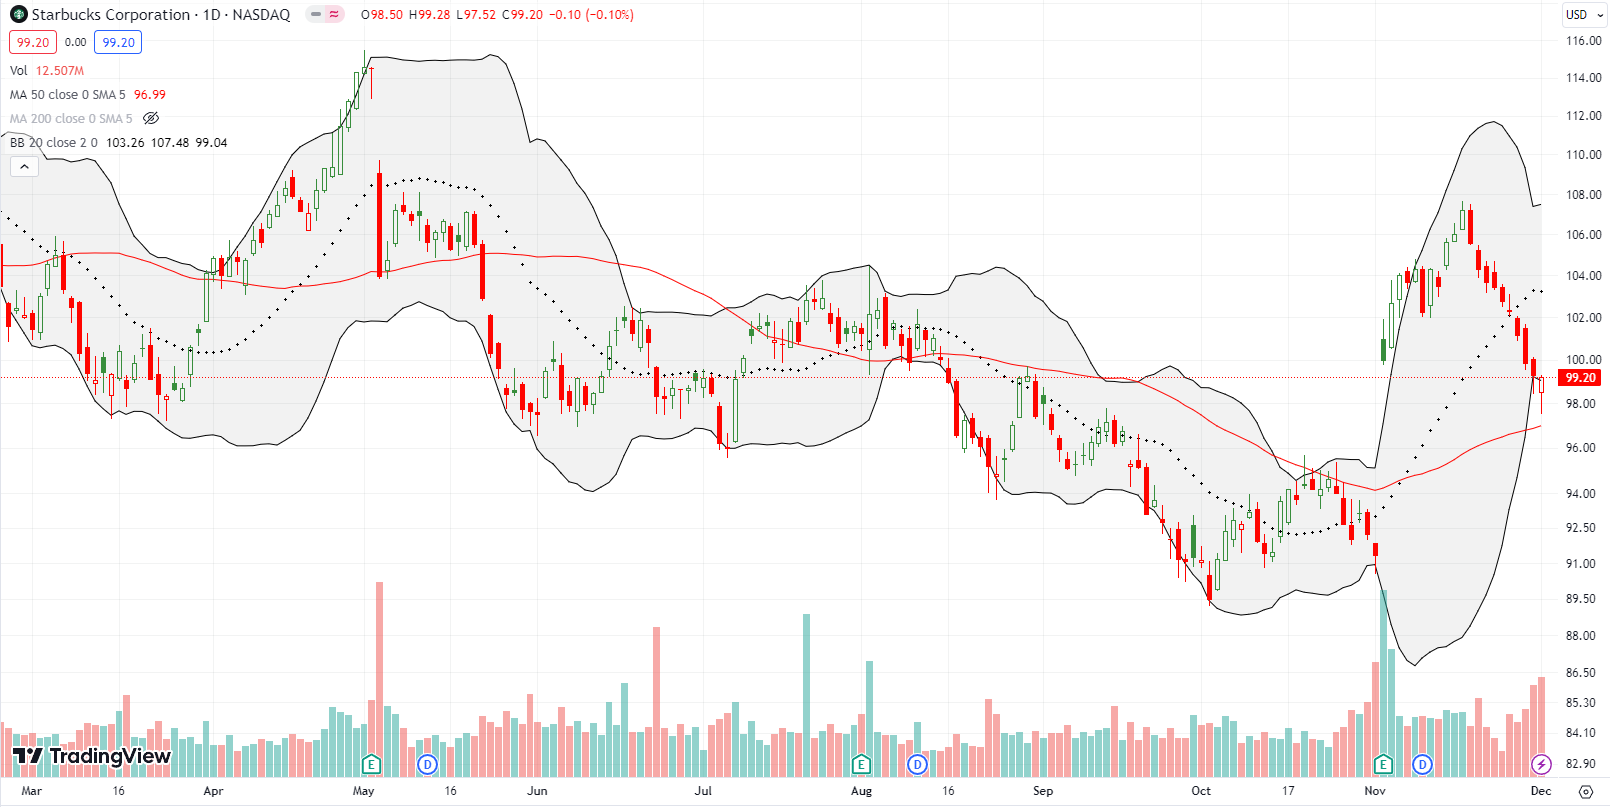
On the negative side, Starbucks Corporation (SBUX) has managed to decline 10 straight days. This is quite a surprising flip from the bullish post-earnings breakout and follow-through. Friday’s rebound away from 50DMA support puts SBUX back on my buy list. I am a buyer if SBUX pushes higher on Monday.
Be careful out there!
Footnotes
Subscribe for free to get email notifications of future posts!
“Above the 50” (AT50) uses the percentage of stocks trading above their respective 50-day moving averages (DMAs) to measure breadth in the stock market. Breadth defines the distribution of participation in a rally or sell-off. As a result, AT50 identifies extremes in market sentiment that are likely to reverse. Above the 50 is my alternative name for “MMFI” which is a symbol TradingView.com and other chart vendors use for this breadth indicator. Learn more about AT50 on my Market Breadth Resource Page. AT200, or MMTH, measures the percentage of stocks trading above their respective 200DMAs.
Active AT50 (MMFI) periods: Day #18 over 20%, Day #16 over 30%, Day #14 over 40%, Day #13 over 50%, Day #10 over 60%, Day #1 over 70% (1st day of overbought ended 79 days below 70%)
Source for charts unless otherwise noted: TradingView.com
Full disclosure: long CAT put spread, long UPS call spread, long ETSY call spread
FOLLOW Dr. Duru’s commentary on financial markets via StockTwits, Twitter, and even Instagram!
*Charting notes: Stock prices are not adjusted for dividends. Candlestick charts use hollow bodies: open candles indicate a close higher than the open, filled candles indicate an open higher than the close.


Brilliant as always.
Thanks!
Where’s call now… we bearish?
Nope! Still neutral.