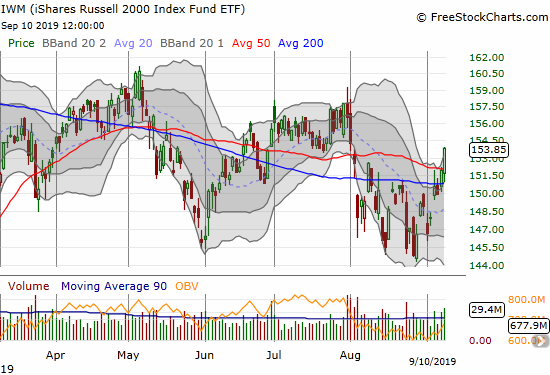
Stock Market Stalls At Overbought Threshold As Momentum Stocks Retreat – Above the 40 (September 13, 2019)

AT40 (T2108) has stalled perfectly at the overbought threshold of 70%.

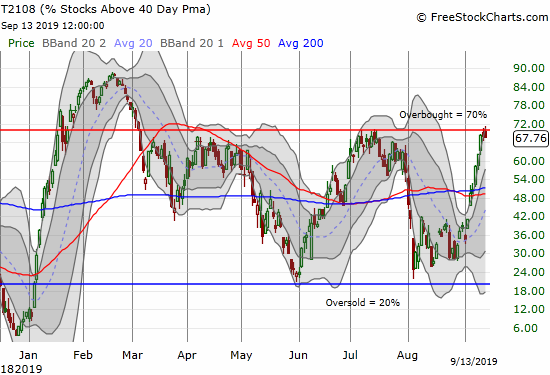
AT40 = 67.8% of stocks are trading above their respective 40-day moving averages (DMAs) AT200 = 58.8% of stocks are trading above their respective 200DMAs (13-month high)VIX = 13.7Short-term Trading Call: neutral Stock Market Commentary Overbought Overrules Times like these remind me of the significance of the overbought line. AT40 (T2108), the percentage of stocks … Read more

Small Caps Answer the Call: Overbought Trading Conditions Now Approach – Above the 40 (September 10, 2019)

The iShares Russell 2000 Index Fund ETF (IWM) has surged through 200 and 50DMA resistance in a high-volume breakout move.

AT40 = 62.1% of stocks are trading above their respective 40-day moving averages (DMAs) AT200 = 55.2% of stocks are trading above their respective 200DMAs (finished reversing all of August’s decline)VIX = 15.2Short-term Trading Call: neutral Stock Market Commentary Role reversal While the S&P 500 (SPY) and the NASDAQ (COMPQX) continue to fail at confirming … Read more

An Obvious Stock Market Breakout Leaves Open Questions – Above the 40 (September 6, 2019)

AT40 = 49.7% of stocks are trading above their respective 40-day moving averages (DMAs) AT200 = 48.1% of stocks are trading above their respective 200DMAsVIX = 15.0Short-term Trading Call: neutral Stock Market Commentary One Obvious Pattern to Another The S&P 500 (SPY) and the NASDAQ (COMPQX) transitioned from an obvious trading range to an obvious … Read more

A Stock Market Stuck In An Obvious Trading Range Still Produces A Rich Set of Expectations – Above the 40 (August 29, 2019)

AT40 = 38.3% of stocks are trading above their respective 40-day moving averages (DMAs) AT200 = 44.1% of stocks are trading above their respective 200DMAs (2-month low)VIX = 19.0Short-term Trading Call: neutral Stock Market Commentary The Trigger Finger On Tuesday (August 27), I saw enough hints of a flip from a bullish to bearish divergence … Read more

A Manic Stock Market Leaves Behind An Extreme August Drawdown – Above the 40 (August 9, 2019)

Much ado about nothing? The 15-minute chart of the S&P 500 (SPY) shows the gory details of a manic swoon to a near flat close for the week.

AT40 = 37.3% of stocks are trading above their respective 40-day moving averages (DMAs) AT200 = 46.5% of stocks are trading above their respective 200DMAs VIX = 18.0Short-term Trading Call: neutral (caveats below!) Stock Market Commentary The S&P 500 (SPY) ended the week almost where it started. In between the bookends, the market gyrated wildly … Read more