
AT40 = 51.3% of stocks are trading above their respective 40-day moving averages (DMAs)
AT200 = 48.9% of stocks are trading above their respective 200DMAs
VIX = 18.6
Short-term Trading Call: cautiously bearish
Stock Market Commentary
The Big Question: Another Q4 Sell-Off?
“Last year can’t happen because of last year”
Tim Seymour, CNBC’s Fast Money, October 1, 2019
Here we go again. It seems like every time the S&P 500 (SPY) loses around 1% or more, the hang wringing begins. The big October to December sell-off of 2018 is the obvious comparison for this cycle. Optimists may tend to think history will not repeat simply because it is “too obvious.” Pessimists may tend to believe that the risks are even higher than a year ago so the market should sell-off hard again.
The Fast Money crew on CNBC discussed the prospects for a repeat of 2018’s stomach churning fourth quarter. Opinions were mixed, but I duly noted the bearish “leanings”. Particularly, perma-bear Dan Nathan did not receive the typical mocking for being bearish.
{Can someone explain to me what Tim Seymour meant by saying “the market is offsides on a move to the upside.” Huh?!?}
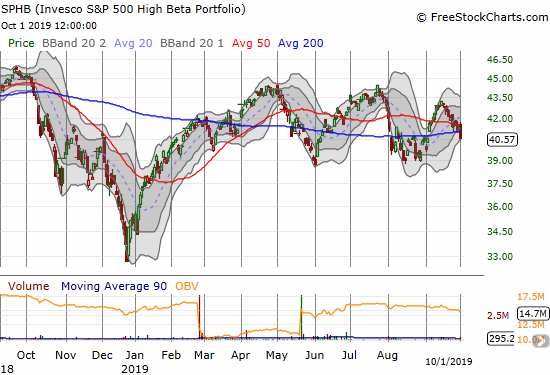
The most interesting claim was that investors are much more defensively positioned than last year. Thus, optimism is lower and the downside potential for the broader market must be lower. Sure enough, Invesco S&P 500 Low Volatility ETF (SPLV), the more defensive part of the S&P 500, and Invesco S&P 500 High Beta ETF (SPHB), the more aggressive part of the S&P 500, are worlds apart year-over-year. SPLV is up a healthy 16.0% since October 1, 2018 while SPHB is DOWN 10.0% over this time period. So investors truly are MUCH more defensively positioned that a year ago and likely feel quite comfortable holding their positions through whatever selling is to come. That hold should provide a buffer to what otherwise could be a steep sell-off absent a fresh collapse in growth/aggressive stocks.

The Slipping Indices
The S&P 500 (SPY) lost 1.2% and closed with a 50DMA breakdown. This action confirmed my flip to “cautiously bearish” for my short-term trading call.

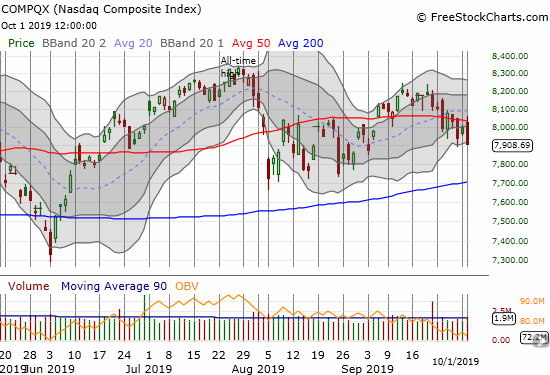
The NASDAQ (COMPQX) on the other hand is back in bearish territory as its 1.1% loss confirmed two previous 50DMA breakdowns. A test of 200DMA support is back in play.
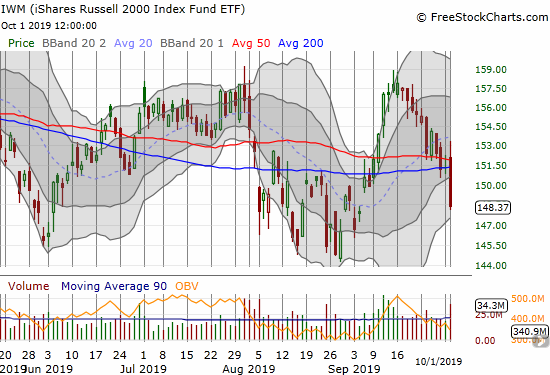
The iShares Russell 2000 Index Fund ETF (IWM) was one of the more dramatic index losers. The index of small caps lost 2.0% and suddenly looks ready to retest the August lows. IWM’s bullish, and now false, breakout last month is a distant memory…
My favorite technical indicator, AT40 (T2108), the percentage of stocks trading above their respective 40-day moving averages (DMAs), delivered once again. I used a drop below 65% as my key tell of a bearish failure to break into overbought territory (above 70%). AT40 dropped from Monday’s drift higher to 64.0% to Tuesday’s plunge to 51.3%. Such a steep drop usually accompanies a significant market sell-off. I am assuming that there are a lot of stocks with flattened trend lines – stocks that are listlessly pivoting around or above these trend lines. In other words, just another week or so of modest selling could suddenly create an oversold market…and the market is already 1/3 of the way to the average maximum drawdown for October.
The drawdowns
September’s maximum drawdown for the S&P 500 all happened on the first day of that month: 0.7%. The average since 1950 is 2.8%. October’s maximum average drawdown is 3.2%. The chart below includes the median for context; the median eliminates the skew that occurs from the few extreme drawdowns that have happened over history.
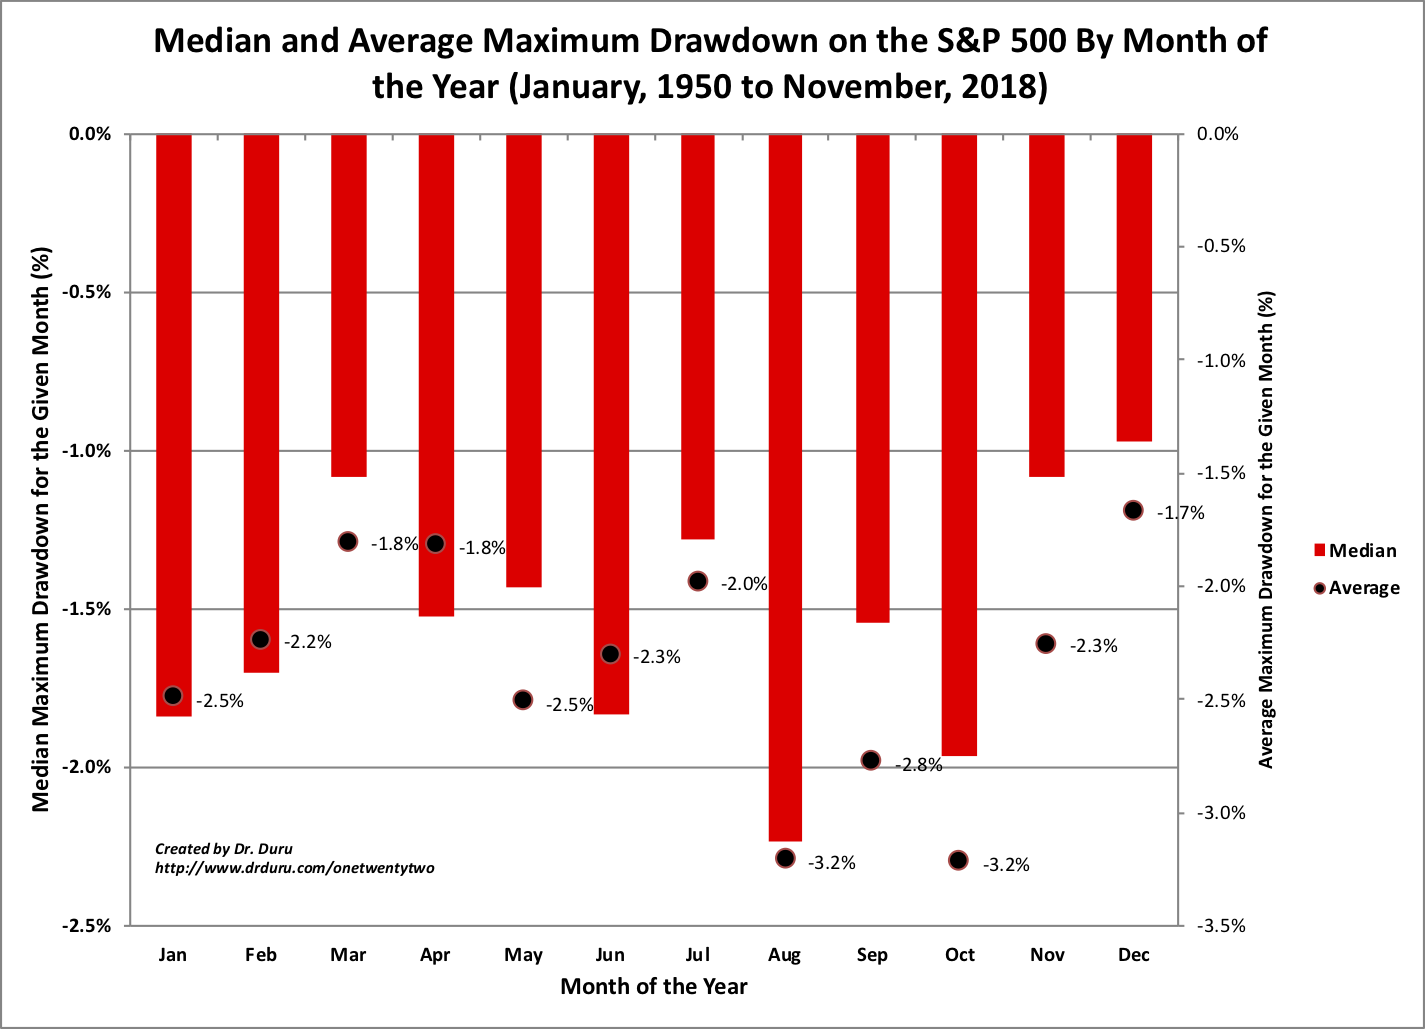
Source for data: Yahoo Finance
A 3.2% drawdown for October would take the S&P 500 to 2881. Such a move neatly returns the index to the middle of August’s trading range. If October churns enough, 2881 could become a fresh test of 200DMA support. This (modest) level is my initial downside target. If selling continues from there, I do not expect the 200DMA to hold firm as support.
Volatility
The volatility index (VIX) managed to close at its high of the day. The VIX gained 14.3% but still closed below the intraday high from last Friday. A higher close would confirm the start of a new up-cycle for the fear gauge.

Currency Market Finally Confirms
In the last Above to 40 post, I looked to the currency markets for a final confirmation for flipping bearish. I did not get that confirmation. Today, I did.
The Australian dollar (FXA) dropped steeply against the Japanese yen (FXY). AUD/JPY broke through 50DMA support, traded at a near one-month low and re-established a tight relative correlation with the S&P 500. A test of the multi-year lows looks like it is in play (read “Why the Australian Dollar and Japanese Yen Matter for Stock Traders” for an explanation for why AUD/JPY matters for traders).
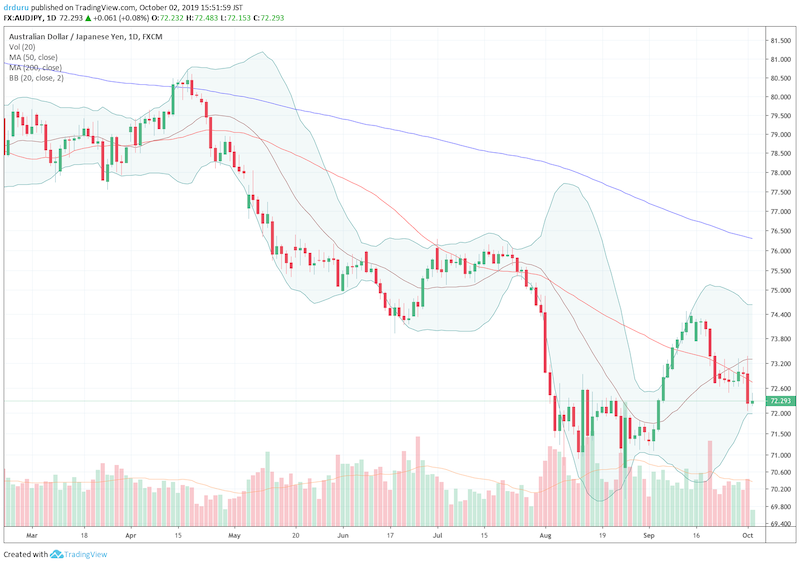
Source: TradingView.com
All Is Well Until It Isn’t
As part of a common pattern, Fast Money trotted out Canaccord Genuity’s Tony Dwyer to remind the audience of the bullish case even as more selling looms. With his 2019 target of 2900 already hit, Dwyer is looking to his 3400 target for 2020. I know Dwyer’s narrative well now: as long as credit conditions are fine, then investors must hold/buy stocks through volatility. I am always fascinated by his regular warning that follows his bull case:
“You guys know me well enough. This does not end well. You cannot fix debt with exponentially more debt. But you have to shut down the availability of that debt….and they haven’t done it yet.”
Canaccord Genuity’s Tony Dwyer, CNBC’s Fast Money, October 1, 2019 (5:40 point in the video below)
I have been meaning to include this ominous outlook from a permabull because I am pretty sure I will need to reference it at some point in the near future.
Stock Chart Reviews – Bearish
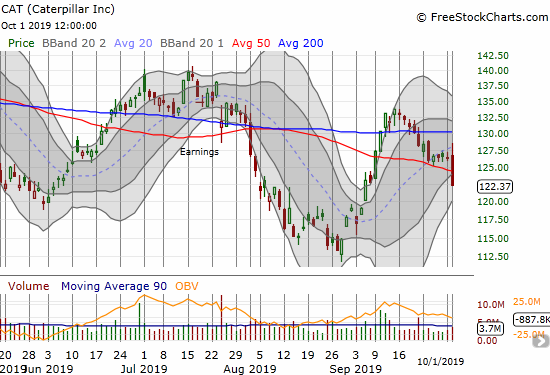
Caterpillar (CAT)
Caterpillar (CAT) punched through 50DMA support for its own confirmation of the market’s more bearish mood. I reloaded on put options after the 200DMA breakdown, but I should have bought more after my flip to cautiously bearish.
Stock Chart Reviews – Bullish
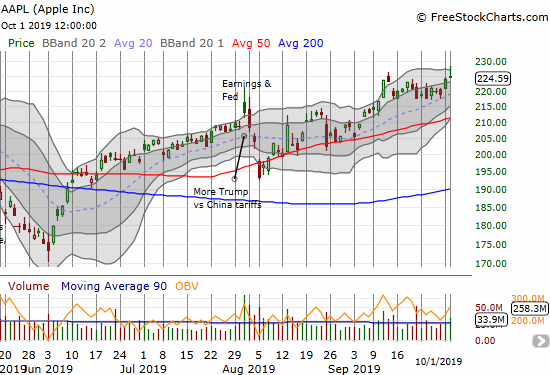
Apple (AAPL)
Seeing Apple (AAPL) up almost 2% on the day gave me visions of writing the post that flipped my short-term trading call right back to neutral. AAPL ended up fading sharply from its intraday high but still outperformed with a fractional gain. AAPL still trades a marginal 52-week high, making the stock stand tall again relative to other big cap tech stocks.
— – —
FOLLOW Dr. Duru’s commentary on financial markets via email, StockTwits, Twitter, and even Instagram!
“Above the 40” uses the percentage of stocks trading above their respective 40-day moving averages (DMAs) to assess the technical health of the stock market and to identify extremes in market sentiment that are likely to reverse. Abbreviated as AT40, Above the 40 is an alternative label for “T2108” which was created by Worden. Learn more about T2108 on my T2108 Resource Page. AT200, or T2107, measures the percentage of stocks trading above their respective 200DMAs.
Active AT40 (T2108) periods: Day #180 over 20%, Day #19 over 30%, Day #31 over 40%, Day #15 over 50% (overperiod), Day #1 under 60% (ending 13 days above 60%), Day #7 under 70%
Daily AT40 (T2108)
")
Black line: AT40 (T2108) (% measured on the right)
Red line: Overbought threshold (70%); Blue line: Oversold threshold (20%)
Weekly AT40 (T2108)

*All charts created using FreeStockCharts unless otherwise stated
The T2108 charts above are my LATEST updates independent of the date of this given AT40 post. For my latest AT40 post click here.
Be careful out there!
Full disclosure: long VIXY calls, short AUD/JPY, long SPY puts, long CAT puts
*Charting notes: FreeStockCharts stock prices are not adjusted for dividends. TradingView.com charts for currencies use Tokyo time as the start of the forex trading day. FreeStockCharts currency charts are based on Eastern U.S. time to define the trading day.
Hey Dr. Duru,
What are your thoughts about Argentina ?
Any thoughts about CAAP – Corporación América Airports ?
I am intrigued by their airport leases but I’m not sure when things will bottom in Argentina – before the election, after the election, after default on government issued bonds ?
Hi DKM – I honestly have no insights on the financial markets or economy in Argentina. I just feel for the people who are struggling with the current turmoil!