
A Bearish Divergence Now Behind, Overbought Awaits for Stocks – Above the 40 (December 20, 2019)
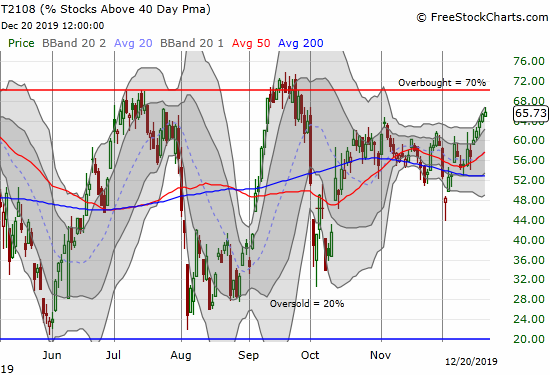
AT40 = 65.7% of stocks are trading above their respective 40-day moving averages (DMAs)AT200 = 59.8% of stocks are trading above their respective 200DMAs (just under high for 2019 of 60.2%)VIX = 12.5Short-term Trading Call: neutral Stock Market Commentary The bearish divergence finally ended between a range-bound AT40 (T2108) and an S&P 500 (SPY) steadily … Read more