The Day the Stock Market Lost Apple

Apple (AAPL) lost 12.9% and broke its 200DMA for the first time during the market collapse.

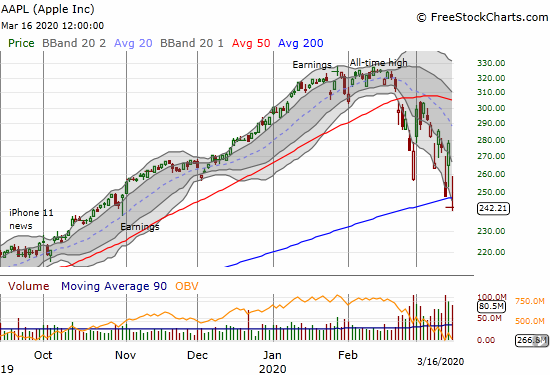
“Looking for one of the 4% of stocks still trading above their respective 200DMAs? Apple (AAPL) is one of those lucky few. If sellers break AAPL, I foresee two binary possibilities: 1) buyers will finally see enough bargains to go on a buying spree, or 2) buyers give up all hope and the resulting rush … Read more

Stock Market Lessons from Cramer In Turmoil

As I scrambled to write my update on a “suddenly oversold” market stock market, I listened to Jim Cramer’s Mad Money. Cramer is naturally entertaining, and I particularly like hearing his take at key market moments like these. On Tuesday, February 25th, Cramer was firmly in the bearish camp on his Mad Money show. He … Read more

A Stock Market Stuck In An Obvious Trading Range Still Produces A Rich Set of Expectations – Above the 40 (August 29, 2019)

AT40 = 38.3% of stocks are trading above their respective 40-day moving averages (DMAs) AT200 = 44.1% of stocks are trading above their respective 200DMAs (2-month low)VIX = 19.0Short-term Trading Call: neutral Stock Market Commentary The Trigger Finger On Tuesday (August 27), I saw enough hints of a flip from a bullish to bearish divergence … Read more

Trade War Realities Weigh More Heavily

The Australian dollar versus the Japanese yen (AUD/JPY) is back to trading at levels last seen in the immediate wake of the financial crisis. A declining AUD/JPY helps to expose the intensifying risk-off sentiment in financial markets.

An Inescapable Truth In June, 2018, I made the following claims and observations (with fresh emphasis): “…at the end of the day, Trump is determined to drive the U.S. trade deficit as close to zero as possible. This cannot happen without some substantial economic disruptions. To the extent the market refuses to price in these … Read more

A Manic Stock Market Leaves Behind An Extreme August Drawdown – Above the 40 (August 9, 2019)

Much ado about nothing? The 15-minute chart of the S&P 500 (SPY) shows the gory details of a manic swoon to a near flat close for the week.

AT40 = 37.3% of stocks are trading above their respective 40-day moving averages (DMAs) AT200 = 46.5% of stocks are trading above their respective 200DMAs VIX = 18.0Short-term Trading Call: neutral (caveats below!) Stock Market Commentary The S&P 500 (SPY) ended the week almost where it started. In between the bookends, the market gyrated wildly … Read more