
Above the 50 Now Defines Key Measure of Stock Market Breadth
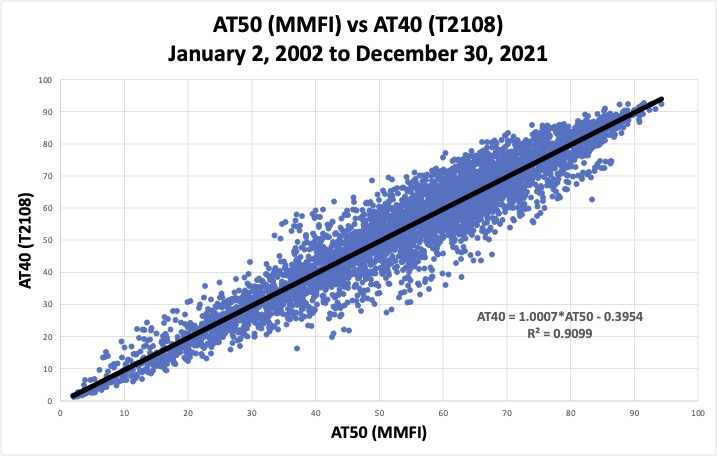
Above the 50 (AT50) Replaces Above the 40 (AT40) I had a long and rewarding journey using AT40 (T2108), the percentage of stocks trading above their respective 40-day moving averages (DMAs), as my key measure of market breadth. Over the past several years Worden and its TC2000 platform gradually reduced support for the FreeStockCharts platform … Read more