
AT40 = 70.1% of stocks are trading above their respective 40-day moving averages (DMAs) – first overbought day
AT200 = 58.7% of stocks are trading above their respective 200DMAs
VIX = 9.5
Short-term Trading Call: cautiously bullish (one more higher close away from bullish)
Commentary
It took 8 months for the stock market to hit overbought again. AT40 (T2108), the percentage of stocks trading above their 40-day moving averages (DMAs), closed at 70.1% – a hair above the overbought threshold of 70%. After one more higher close I will switch the short-term trading call to bullish.
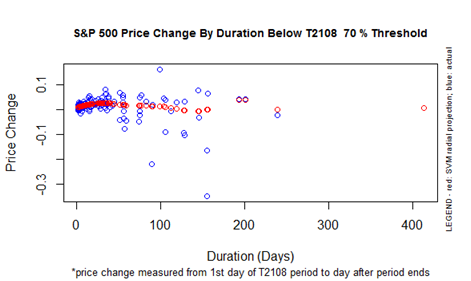
The S&P 500 (SPY) is up an incredible 9.2% since the last overbought period ended (it lasted just one day on January 25, 2017). This performance is a large outlier. Not only has AT40 rarely spent anything close to 160 trading days under 70%, but also only TWO other 70% underperiods have performed as well as this last one did. The chart below shows a projected performance under 5% for a 70% underperiod surviving as long as the the last one.
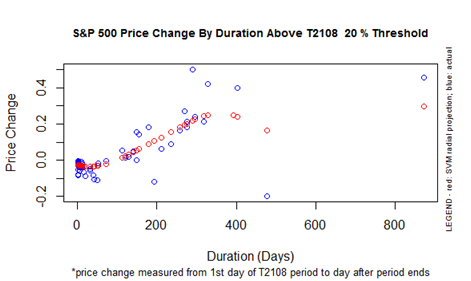
Separately, AT40 has now gone 401 days without trading below the oversold threshold of 20%. This duration ties for third longest trading period without an oversold period. The last oversold period ended on February 12, 2016 in what I dubbed at the time the “JP Morgan Chase Bottom.” The S&P 500 has gained 32% since then. Projected performance suggests that the end of this 20% overperiod might cut this gain almost in half…with a heavy caveat given the sparseness of data that comes with such an outlier occurrence.
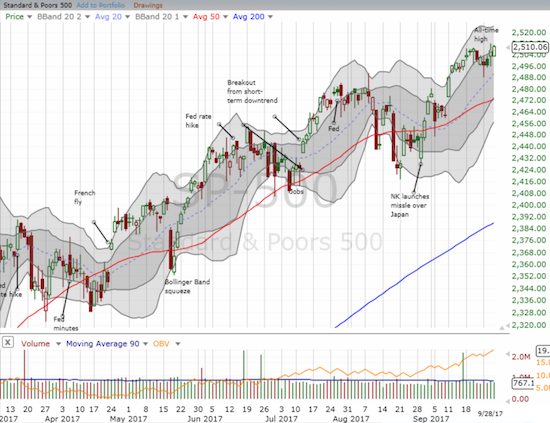
Appropriately, the S&P 500 (SPY) marked this overdue overbought occasion with a new all-time high.
The NASDAQ closed flatline and just short of a fresh all-time high. The PowerShares QQQ ETF (QQQ) is still struggling to hold onto its 50DMA support. Assuming AT40 confirms a new bullish phase for the market, I will likely load up on QQQ call options. My swing at individual members of the big cap high tech stocks this week had very mixed results.
The volatility index, the VIX, hit 9.6, within a small fraction of a point of the 24-year closing low set in July and the all-time (tracked) closing low of 9.31 on December 22, 1993. My last tranche of call options on the ProShares Ultra VIX Short-Term Futures (UVXY) will expire worthless, and I will reload for hedging against the potential for October to deliver fresh surprises.
STOCK CHART REVIEWS
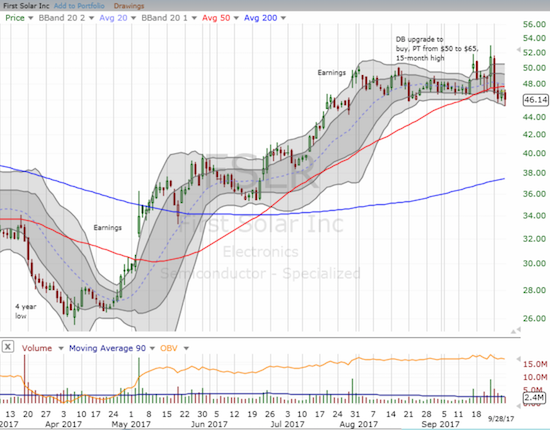
First Solar (FSLR)
It looks like I locked in profits on my FSLR call options just in time. FSLR began the week by immediately reversing Friday’s breakout and in turn broke 50DMA support. I will not take another swing until/unless the company can close above its 50DMA again.
Hanging in the balance is the fate and impact of solar panel tariffs.
IHS Markit (INFO)
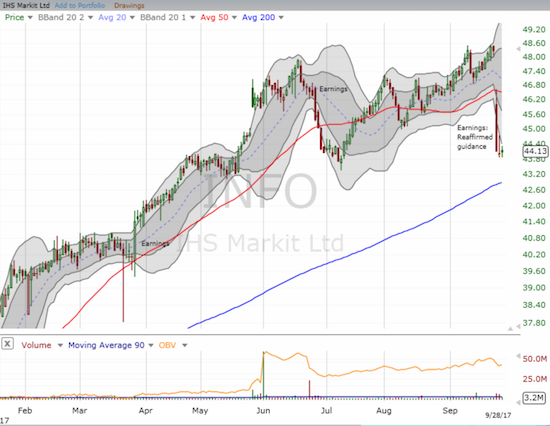
On Tuesday, INFO gave what seemed to me a reassuring reaffirmation of guidance. The market disagreed. INFO gapped down below its 50DMA support and kept selling off. Like the dip in July, this selling reversed my gains. I will next look for 200DMA support to hold.
Model N (MODN)
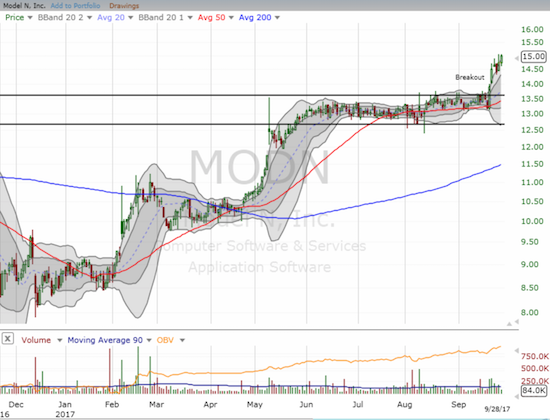
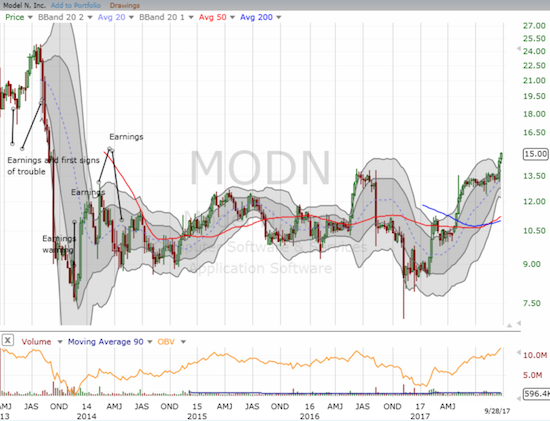
I last wrote about Model N (MODN) almost four years ago. I flagged the revenue management company as a bet on a comeback story. The stock never took off but did deliver a small profit on a rally to the top of what became a very extended trading range. Now, MODN is FINALLY breaking out, and it has my attention again. At $15, MODN sits at a 4-year high. The next earnings report comes around November 6th so there could be a long runway here if the general market remains bullish.
— – —
FOLLOW Dr. Duru’s commentary on financial markets via email, StockTwits, Twitter, and even Instagram!
“Above the 40” uses the percentage of stocks trading above their respective 40-day moving averages (DMAs) to assess the technical health of the stock market and to identify extremes in market sentiment that are likely to reverse. Abbreviated as AT40, Above the 40 is an alternative label for “T2108” which was created by Worden. Learn more about T2108 on my T2108 Resource Page. AT200, or T2107, measures the percentage of stocks trading above their respective 200DMAs.
Active AT40 (T2108) periods: Day #401 over 20%, Day #215 over 30%, Day #15 over 40%, Day #14 over 50%, Day #10 over 60%, Day #1 over 70% (overbought, ending 160 days under 70%)
Daily AT40 (T2108)
")
Black line: AT40 (T2108) (% measured on the right)
Red line: Overbought threshold (70%); Blue line: Oversold threshold (20%)
Weekly AT40 (T2108)

*All charts created using freestockcharts.com unless otherwise stated
The charts above are my LATEST updates independent of the date of this given AT40 post. For my latest AT40 post click here.
Related links:
The T2108 Resource Page
You can follow real-time T2108 commentary on twitter using the #T2108 or #AT40 hashtags. T2108-related trades and other trades are occasionally posted on twitter using the #120trade hashtag.
Be careful out there!
Full disclosure: long INFO, long UVXY call options
*Charting notes: FreeStockCharts.com uses midnight U.S. Eastern time as the close for currencies. Stock prices are not adjusted for dividends.
Axon: I tend to think the Alzheimer’s space is uninvestable until someone comes out with something that is disease modifying. Until then, it’s a pump and dump small cap space. Which is ok if you are into that.
I’m still intrigued by the softs/Ag meme. Not sure if we get a further low before the major upturn. Probably a grinding market for a while but hard to see it lower in 10 years.
It should be very interesting to see whether the fed hikes in Dec. With imputed probabilities at 75%, they would need to bring expectations back a long way from here. On the other hand if they do hike in Dec, I think SPX, which has been taking it pretty well may finally crack. With another hike in Dec, the next recession would likely be 9-18 months away. I am almost tempted to buy VIX late Nov. Market may melt up with more of the reflation meme or it could start topping out.
I’ve been thinking of goals and I am not sure if this is realistic, but I would like to play any remainder reflation trade, then find some crazy junk to short (like TSLA or bitcoin), ride that down and then convert to SPX shorts. Easier said than done. That is the prize for me and the little trades around the edges here are just to stay warm. My goal is to have enough to retire on by the time I’m 50, in 7 years time if I can play this reasonably. The problem
with this sort of strategy is not to get in too early otherwise you can end up diving into a foot deep pond instead of what you thought was a 2M deep pool. And of course things never go as planned. I suppose, what I’m waiting for is some fat pitches that this late cycle will hopefully bring up.
Had a look at Van tharps website today. Have you used or bought any of his stuff on trading ?
Another one I’m pondering is short high yield (e.g SJB). So the choices for me are one or a combination of:
– long Ags
– short high yield
– long VIX
Out of the latter 2, the risk/reward seems better for short high yield currently. Short VIX, long put options is such a killer if the timing is wrong. Maybe in 6 months.
I am obviously more hopeful about Alzheimer’s. Sometimes you bet on management, and that’s the case with Axon. Note that a buy has not yet triggered for me.
I just bought coffee (JO) assuming it will successfully retest recent lows.
What makes you think one more rate hike could trigger a recession? I think maybe housing plateaus for a while, but that market activity is a small version of its former self in terms of contribution to the economy.
Your goals are indeed ambitious! I have not dared to think my trading could fund retirement. That would be great though!
I read one of his trading books many years ago. Never thought to look for a website!
I wouldn’t short high yield until I was pretty clear a recession was in its early stages. Even then, I would be cautious! Thanks for pointing out SJB though. I didn’t know about it.
The VIX plays are tough for more than a week or two. That’s how I am playing them.
I think ag is way under-valued.